
Figures & data
Figure 1. The improvement of intestinal mucosal permeability. (a) Effects on small intestinal villi; (b) Effects on intestinal tight junction proteins in the intestinal epithelium. C, control group; M, model group; P, positive group; R-l, raw licorice low dose group; R-h, raw licorice high dose group; H-l, honey-roasted licorice low-dose group; H-h, honey-roasted licorice high-dose group. *p < .05, **p < .01 ***p < .001 vs. M; #p < .05, ##p < .01, ###p < .001 R-l vs. H-l, R-h vs. H-h (n = 3).
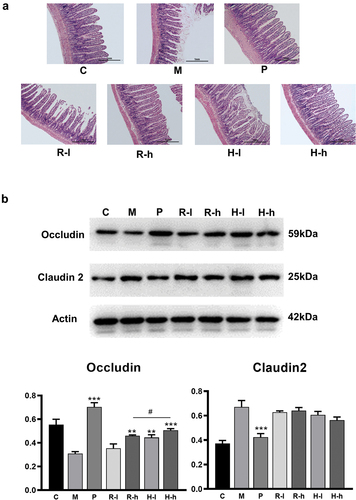
Figure 2. The improvement of immune function. C, control group; M, model group; P, positive group; R-l, raw licorice low-dose group; R-h, raw licorice high dose group; H-l, honey-roasted licorice low dose group; H-h, honey-roasted licorice high dose group. *p < .05, **p < .01, ***p < .001 vs. M; #p < .05, ##p < .01, ###p < .001 R-l vs. H-l, R-h vs. H-h (n = 6).
Figure 3. The overall structure of the gut microbiota. (a) PCoA on OUT level of different groups (n = 6). (b) the relative abundance at the phylum level. C, control group; M, model group; R-h, raw licorice high dose group; H-h, honey-roasted licorice high dose group.
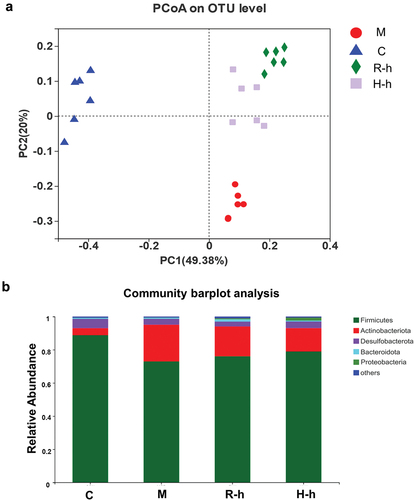
Figure 4. The composition of gut microbiota (n = 6). (a) Cladogram generated from LEfSe analysis for C, M, R-h, and H-h groups; nonparametric factorial Kruskal-Wallis (KW) sum-rank test, LDA> 3.5, p < .05. (b) Heatmap of gut microbiota at the genus level based on LEfSe analysis results. (c) Group difference analysis of representative intestinal bacteria. (Compared to the M group, *p < .05, **p < .01. Comparison of R-h group and H-h group, #p < .05, ##p < .01). C, control group; M, model group; R-h, raw licorice high-dose group; H-h, honey-roasted licorice high-dose group.
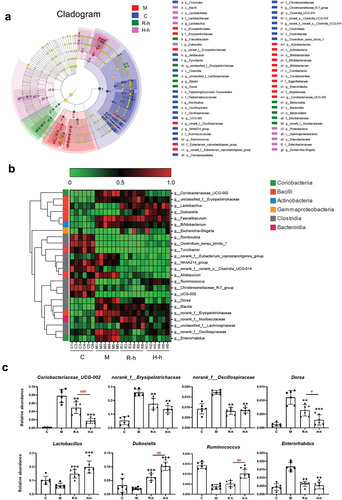
Figure 5. The levels intestinal short-chain fatty acids in rats. C, control group; M, model group; R-h, raw licorice high dose group; H-h, honey-roasted licorice high dose group. *p < .05, **p < .01, ***p < .001 vs M; #p < .05, ##p < .01, ###p < .001 R-l vs. H-l, R-h vs. H-h (n = 6).
Supplemental Material
Download MS Word (146.6 KB)Data availability statement
The datasets used and/or analyzed during the current study are available from the corresponding author on reasonable request.