Figures & data
Figure 1. Effects of COS on ROS production and cell viability in GC-1 spg cells treated with t-BHP. (a) DCFH-DA was used to detect intracellular ROS. Scale, 200 μm. Green fluorescence represents DCFH-DA, which also represents ROS level. (b) Cell quantification was observed by green fluorescence. The results were presented as x ± SD (n = 3). ***p < .001 compared with the t-BHP group, ###p < .001 compared with the control group, ns indicates not statistically significant. (c) Use light microscopy to make morphological observations of each group of cells. Scale, 100 μm. (d) Effects of COS on the viability of t-BHP-induced GC-1 spg cells were detected by CCK-8. The results were presented as x ± SD (n = 3). **p < .01, ***p < .001 compared with the t-BHP group; ####p < .0001 compared with the control group; ns indicates not statistically significant.
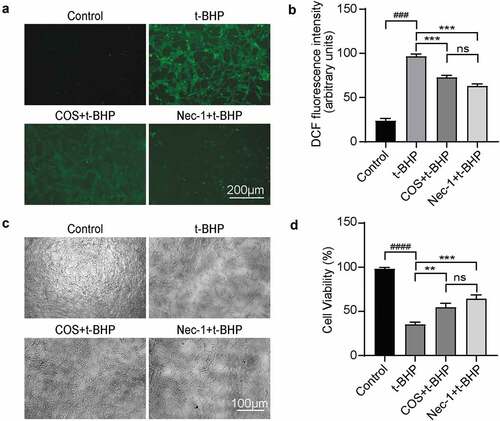
Figure 2. Effects of COS on cell viability and the expression of p-MLKL, RIP-3, and RIP-1 in GC-1 spg cells treated with t-BHP. (a) The mRNA level of RIP-3 and RIP-1 in GC-1 spg cells was detected by RT-PCR. The results are presented as x ± SD (n = 3). *p < .05, **p < .01, ***p < .001 compared with the t-BHP group; ##p < .01, ###p < .001 compared with the control group; ns indicates not statistically significant. Protein level of p-MLKL, RIP-3, and RIP-1 in GC-1 spg cells was determined by western blot, and the results are presented as x ± SD (n = 3). **p < .01 compared with the t-BHP group; ##p < .01, ###p < .001 compared with the control group; ns indicates not statistically significant. (b) The fluorescence intensity of p-MLKL was detected by immunofluorescence. Scale, 400 μm.
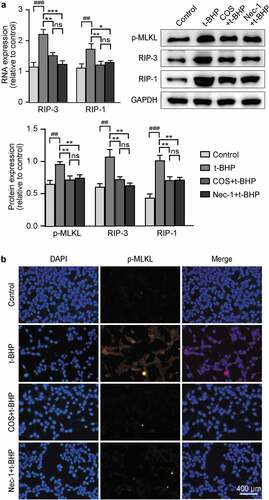
Figure 3. Effects of COS on mitochondrial membrane potential in GC-1 spg cells treated with t-BHP. (a) JC-1 kit was used to detect mitochondrial membrane potential in GC-1 spg cells treated with t-BHP. Green fluorescence represents JC-1 monomer and red fluorescence represents JC-1 complex. Scale, 500 μm. (b) Cell quantification was observed by green and red fluorescence. The results were presented as x ± SD (n = 3). *p < .05 compared with the t-BHP group, ns indicates not statistically significant.
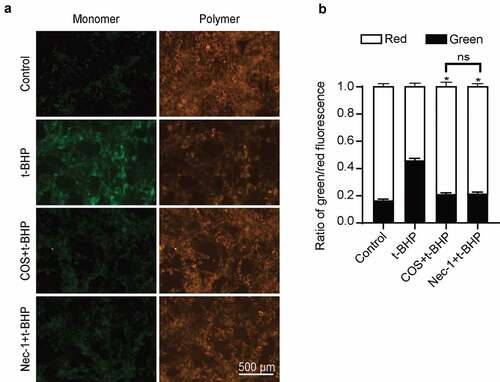
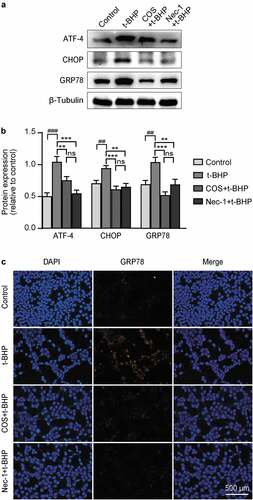
Figure 4. Effects of COS on the expression of ATF-4, chop, and GRP78 in GC-1 spg cells treated with t-BHP. (a) ATF-4, CHOP, and GRP78 expression levels in GC-1 spg cells were determined by western blot. (b) The results are presented as ATF-4/β-Tubulin, CHOP/β-Tubulin, and GRP78/β-Tubulin. The results are presented as x ± SD (n = 3). **p < .01, ***p < .001 compared with the t-BHP group; ##p < .01, ###p < .001 compared with the control group; ns indicates not statistically significant. (C) The fluorescence intensity of GRP78 was detected by immunofluorescence. Scale, 500 μm.