
Figures & data
Figure 1. Colony characteristics and liquid fermentation of five filamentous fungi (a). Morphology of mycelia and spores of strain DBFL05 (b).
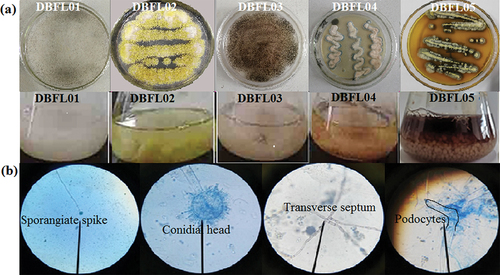
Figure 2. Phylogenetic tree of strain DBFL05.
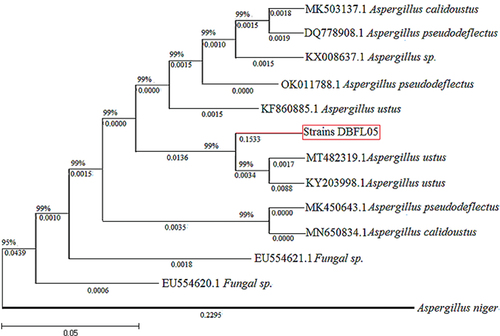
Figure 3. Solubility of pigment (a – Pigment powder, b – Ethyl acetate, c – Acetone, d – Petroleum ether, e – Chloroform, f – Normal butanol, g – Methylbenzene, h – Fermentation broth, I – Methyl alcohol, J – Ethanol, K – 80% ethanol, L – 60% ethanol, M – 40% ethanol, N – 20% ethanol) (a). Maximum absorption peak of pigment (b). Effects of light, temperature, and pH on pigment stability. The wavelength for absorbance was 298 nm (c). Effect of metal ions on pigment stability. The wavelength for absorbance was 298 nm (d). The data represent the average of three independent experiments. Error bars represent the standard deviation. *P < .05, calculated by t test.

Figure 4. HPLC chromatogram of the original pigment sample. The detection wavelength was 298 nm (a). UV–vis spectra of the pigment components and original sample. The wavelength range was 200–800 nm (b).
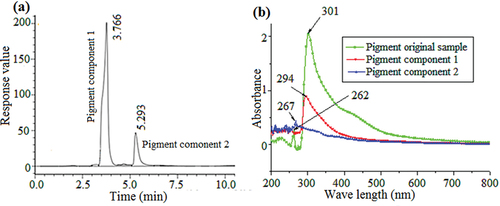
Figure 5. GC of pigment original samples and components (a). Mass spectrometry of pigment components 1 and 2 (b). Mass spectrometry NIST comparative analysis of pigment components 1 and 2 (c).
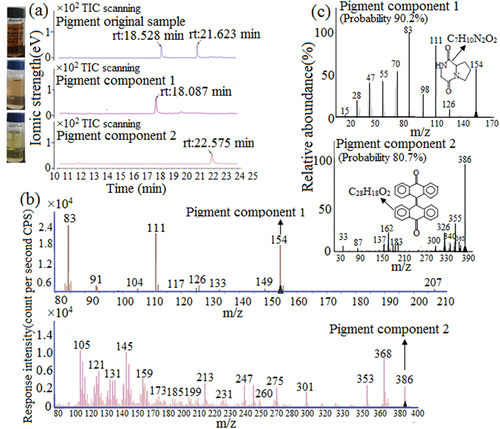
Figure 6. Inhibition effect of pigment components 1 and 2 on microorganisms (a). Antioxidant capacity of pigment components 1 and 2. The wavelength for absorbance was 298 nm (b). The data represent the average of three independent experiments. Error bars represent the standard deviation. *P < .05, calculated by t test.
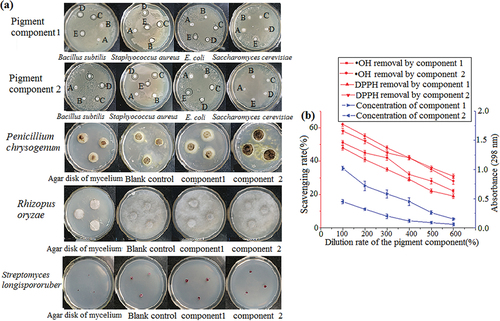
Table 1. Toxicity test of Aspergillus ustus pigment to brine shrimp.
Table 2. Effect of Aspergillus ustus pigment on germination rate, stem length, root length, number of rhizosphere colonies, and nitrogen content of rhizosphere.