Figures & data
Figure 1. Total phenol content (TPT) of C. aconitifolius tea infusions.
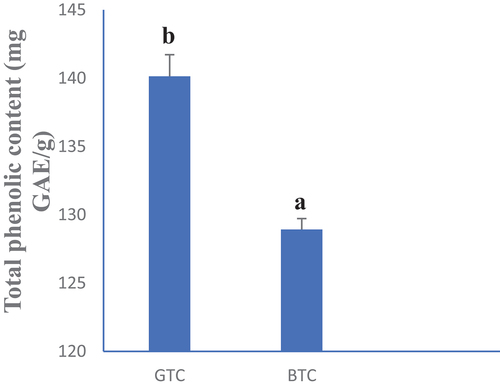
Figure 2. Total flavonoid (TFT) content of C. aconitifolius tea infusions.
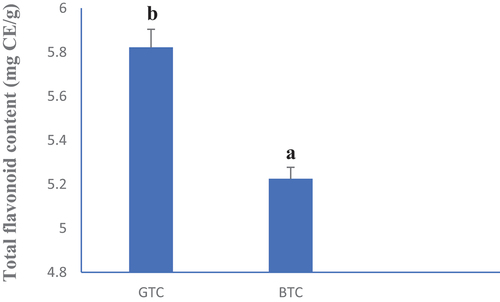
Figure 3. Evolution of the antiradical activity of C. aconitifolius tea infusions at different concentrations compared to vitamin C. GTC: Green tea, BTC: Black tea, Vit C: Vitamin C.
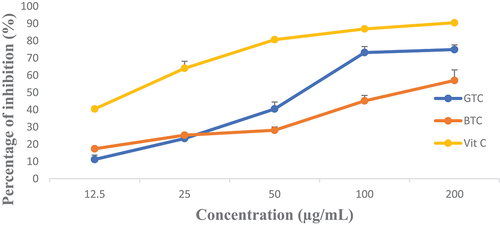
Figure 4. Evolution of the reducing power of C. aconitifolius tea infusions compared to BHT.
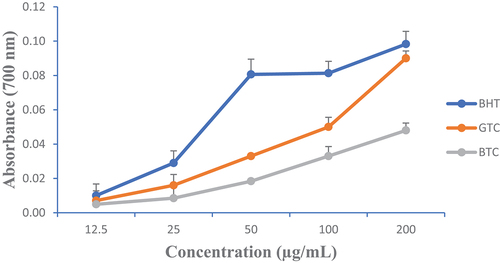
Figure 5. Changes in the hydroxyl radical inhibitory capacity of tea infusion at different concentrations compared to that of BHT.
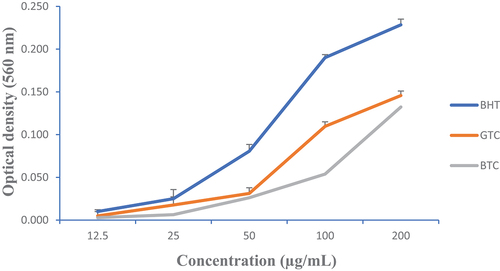
Table 1. Changes in the FBG (g/L) during the treatment.
Figure 6. Serum concentration of triglycerides, total cholesterol, HDL cholesterol and LDL cholesterol in animals after 28 days of treatment. T (-): Healthy control; T (+): untreated diabetics; MET: Metformin; GTC: Green tea; BTC: Black tea. a, b, c and d: On the same graph, bands with different letters differ significantly (p < .05).
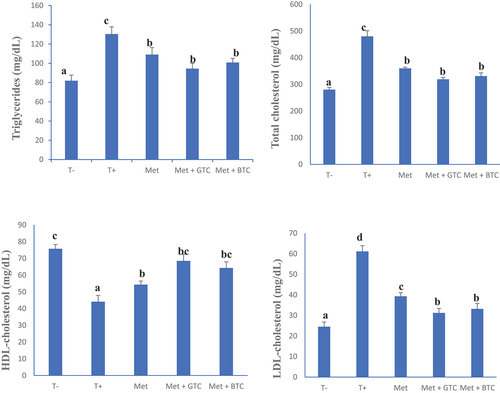
Figure 7. Serum levels of alanine aminotransferase (ALT), aspartate aminotransferase (AST), alkaline phosphatase (ALP) and total protein after 28 days of treatment. T (-): Healthy control; T (+): untreated diabetics; MET: Metformin; GTC: Green tea; BTC: Black tea. a, b and c: On the same graph, bands with different letters differ significantly (p < .05).
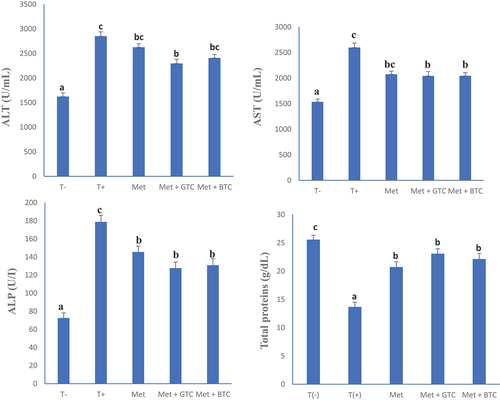
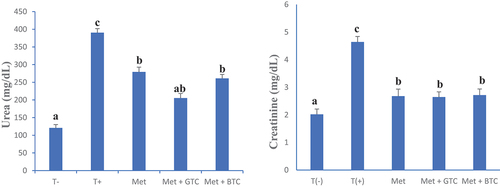
Figure 8. Serum urea and creatinine concentrations in animals after 28 days of treatment. T (-): Healthy control; T (+): untreated diabetics; MET: Metformin; GTC: Green tea; BTC: Black tea. a and b: On the same graph, bands with different letters differ significantly (p < .05).