Figures & data
Figure 1. Silibinin alleviates ER stress and apoptosis of GLUTag cells induced by PA. (a) GLUTag cells were stained with ER-Tracker Red and visualized by confocal microscopy. (b, c) Expression levels of BiP, p-PERK (Thr981), XBP1, ATF6, CHOP and Caspase12 were evaluated by western blotting. (d) Apoptosis was detected by Hoechst 33258 staining. The mean ± S.E.M is shown. *P < .05 versus control group; #P < .05 versus PA group.
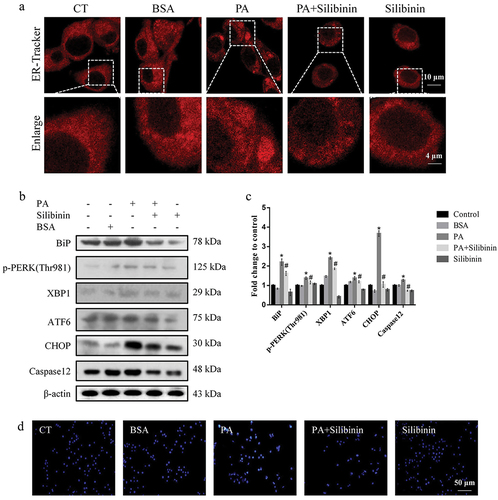
Figure 2. Silibinin reduces PA-induced autophagy in GLUTag cells. (a) the red fluorescence of autophagic morphology stained with AO was visualized by confocal microscopy. (b, c) Expression levels of Beclin1, ATG5 and LC3 were evaluated by western blotting. (d, e) the cells were stained with AV-PI and the ratio (%) of apoptotic cells were analyzed by flow cytometry. (f, g) Expression levels of Bax, Bcl2 and cleaved PARP were evaluated by western blotting. The mean ± S.E.M is shown. *P < .05, **P < .01, ***P < .001 versus BSA group; #P < .05, ##P < .01, ###P < .001, ####P < .0001 versus PA group; &P < .05, &&P < .01, &&&P < .001 versus PA + Silibinin group.
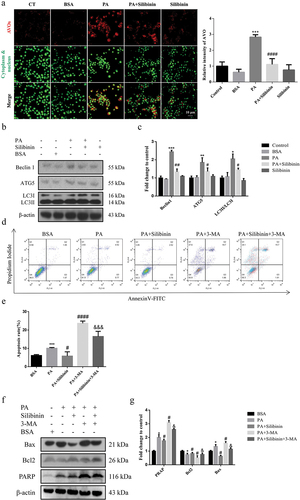
Figure 3. Silibinin downregulates PA-induced autophagy of GLUTag cells by inhibiting ER stress. (a, b) Expression levels of BiP, p-PERK (Thr981), XBP1, ATF6, CHOP and Caspase12 were evaluated by western blotting. (c, d) Expression levels of Beclin1, ATG5 and LC3 were evaluated by western blotting. Data are expressed as mean ± S.E.M. *P < .05 versus BSA group; #P < .05 versus PA group; &P < .05 versus PA + Silibinin group.
Figure 4. Silibinin ameliorates PA-induced ER stress of GLUTag cells through estrogen receptors α and β. Representative western blots (a) and quantitative analysis (b) of BiP, p-PERK (Thr981), XBP1, ATF6, CHOP and Caspase12 in GLUTag cells with indicated treatments. Data are expressed as mean ± S.E.M. *P < .05 versus BSA group; #P < .05 versus PA group; &P < .05 versus PA + Silibinin group.