Figures & data
Figure 1. (a) The macroscopic images of abdominal subcutaneous fat and (b) body weight, (c) waist circumference, (d) body length, (e) BMI index in all studied groups. Data are expressed as mean ± standard deviation. #P < .05 vs Control group; &P < .05 vs HFD group;*P < .05; **P < .01; ***P < .001.
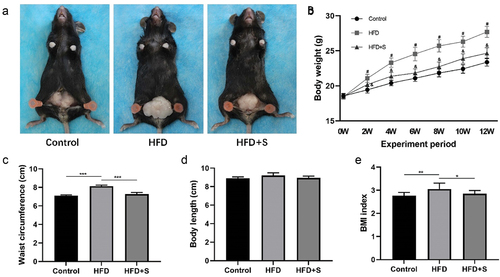
Figure 2. (a, c, e) Representative histological sections indicated that the accumulation of neutral lipid and the progression of OA was attenuated by simvastatin. (B) the quantified cross-sectional area of adipocytes among the groups. (d) the quantified number of adipose cells among the groups. (f) OARSI scores of each group. Data are expressed as mean with 95% confidence interval. Bar = 100 μm. *P < .05; **P < .01; ***P < .001.
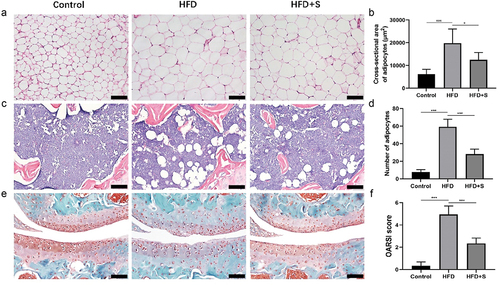
Figure 3. Immunohistochemical staining for aggrecan, collagen-II, ADAMTS-4, MMP-13 and leptin in cartilage. (a, c, e, g, i) the intervention of simvastatin promotes aggrecan, collagen-II expression and inhibits MMP-13, leptin expression in the cartilage of mice with a HFD. (b, d, f, h, j) the quantified protein levels of aggrecan, collagen-II, ADAMTS-4, MMP-13 and leptin in cartilage. Data are expressed as mean ± standard deviation. Bar = 20 μm. *P < .05; **P < .01; ***P < .001.
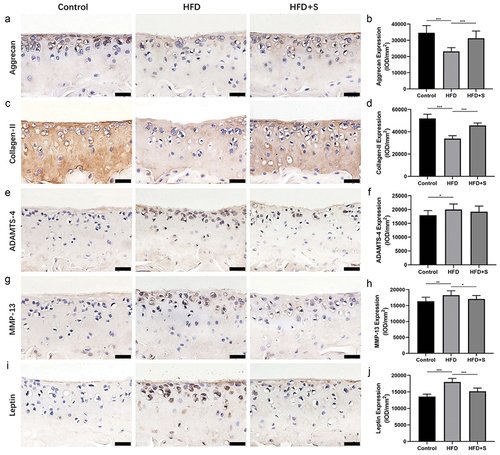
Figure 4. The intervention of simvastatin improves the imbalanced subchondral bone metabolism in HFD mice. (a) Representative OCN-stained sections with quantification of the (b) number of osteoblasts (N. OBs) on trabecular bone surface (BS) in tibia subchondral bone. (c) Representative TRAP-stained sections with quantitation of the (d) number of osteoclasts (N. OCs). Data are expressed as mean with 95% confidence interval. Bar = 100 μm. *P < .05; **P < .01; ***P < .001.
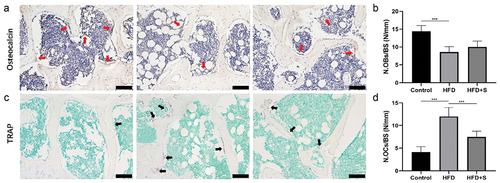
Figure 5. The simvastatin improves the decreased bone mass and impaired bone microstructures induced by HFD. (a) the representative micro-CT images of the femur and tibial subchondral bone. (b-g) Morphological parameters of the trabecular bone mineral density (BMD), Bone Volume/Total Volume (BV/TV), Trabecular Number (Tb.N), Trabecular Thickness (Tb.Th), Trabecular Separation Distance (Tb.Sp), Structure model index (SMI). Data are expressed as mean ± standard deviation. *P < .05; **P < .01; ***P < .001.
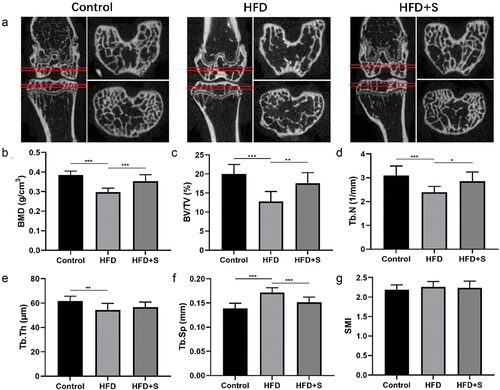
Table 1. Differences between serum metabolite parameters measured in all groups.
Figure 6. Spearman’s rank correlations. (a–c) Analysis of correlations between Serum concentrations of glucose, leptin, IL-1β and OARSI score. The regression line (solid) is shown. Data are expressed as mean ± standard deviation. *P < .05; **P < .01; ***P < .001.