Figures & data
Figure 1. DMY promoted LDLR expression in HepG2 cells. (a) cell viability (MTT assay) of HepG2 cells treated with DMY (5–40 μM) for 24 h. (b, c) Western blot analysis showing LDLR protein levels in HepG2 cells treated with DMY (5–40 µM) for 24 h. (d) LDLR mRNA levels (qRT-PCR) in HepG2 cells treated with DMY (5–40 µM) for 24 h. The values are expressed as means ± SEM (n = 3). *p < .05, **p < .01 and ***p < .001 compared with the control group. DMY, Dihydromyricetin. LDLR, low-density lipoprotein receptor.
Figure 2. DMY increased LDL uptake in HepG2 cells. (a) Representative fluorescent micrographs show the intake levels of DiI-LDL (red) in HepG2 cells treated with DMY (5–40 µM). (b) Quantitative analysis showing Dil-LDL levels in HepG2 cells treated with DMY (5–40 µM). The values are expressed as means ± SEM (n = 3). *p < .05 and **p < .01 compared with the control group. DMY, Dihydromyricetin. LDL, low-density lipoprotein.
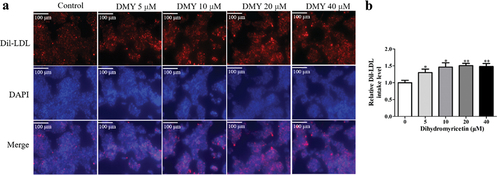
Figure 3. DMY inhibited PCSK9 expression in HepG2 cells. (a, b) Western blot analysis showing PCSK9 protein levels in HepG2 cells treated with DMY (5–40 µM) for 24 h. (c) qRT-PCR results showing PCSK9 levels in HepG2 cells treated with DMY (5–40 µM) for 24 h. (d) ELISA results showing PCSK9 content in the cell culture medium with DMY (5–40 µM) for 24 h. The values are expressed as means ± SEM (n = 3). *p < .05 and ***p < .001 compared with the control group. DMY, Dihydromyricetin. PCSK9, proprotein convertase subtilisin/kexin type 9.
Figure 4. DMY inhibited the expression of the transcription factors HNF1A in HepG2 cells. (a–c) Western blot analysis showing HNF1A and FoxO3 protein levels in HepG2 cells treated with DMY (5–40 µM) for 24 h. (d, e) qRT-PCR results showing HNF1A and FoxO3 mRNA levels in HepG2 cells treated with DMY (5–40 µM) for 24 h. The values are expressed as means ± SEM (n = 3). *p < .05, **p < .01, and ***p < .001 compared with the control group. DMY, Dihydromyricetin. HNF1A, hepatocyte nuclear factor 1A. FoxO3, forkhead box O3.
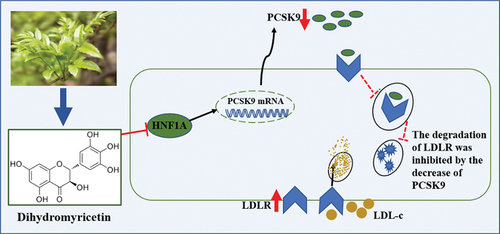
Figure 5. Schematic diagram of the mechanism by which DMY regulates the PCSK9/LDLR pathway. PCSK9, proprotein convertase subtilisin/kexin type 9. LDLR, low-density lipoprotein receptor. HNF1A, hepatocyte nuclear factor 1A. LDL-c, low-density lipoprotein cholesterol.