Figures & data
Figure 1. Schematic representation of silanized substrates with reacted glutaraldehyde (a) and terephthalaldehyde (b) as crosslinkers.
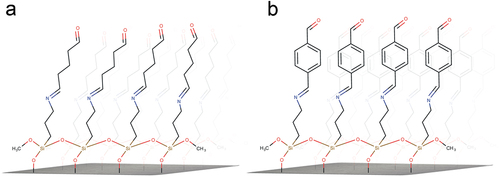
Figure 2. FT-IR spectra of the glutaraldehyde biosensor assembly process. (a) silanized silicon wafer; (b) Silanized silicon wafer with glutaraldehyde as crosslinker and (c) complete biosensor with immobilized DAO. Spectra were normalized.
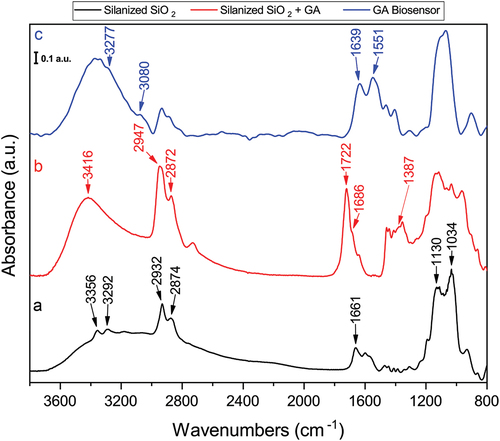
Figure 3. Normalized FT-IR spectra of the silanized substrate after TA reaction, (a); and DAO biosensor assembled with TA, (b).
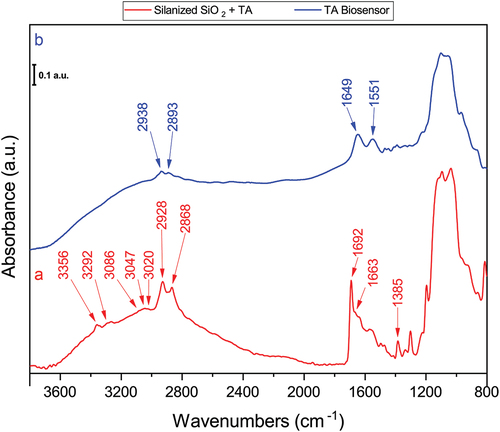
Figure 4. SEM of GA and TA biosensors assembly stages. (a) SiO2 substrates after hydroxylation with piranha solution; (b) 3-APTMS functionalized substrate; (c) 3-APTMS functionalized substrate after glutaraldehyde treatment; (d) 3-APTMS functionalized substrate after terephthalaldehyde substrate; (e) TA biosensor and (f) GA biosensor. Insets: averaged EDX-elemental composition of three zones.
Figure 5. AFM images (top) and roughness profile plots (bottom) of silicon substrates after treatment with piranha solution, (a); after functionalization by gas phase, (b); after functionalization by toluene immersion, (c). White lines indicate the measurement range; roughness RMS values are plotted as dotted lines.
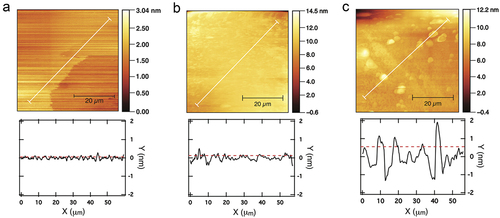
Table 1. Interaction type and affinity energies for crosslinker-DAO complexes.
Figure 6. Best poses of ligand-receptor complexes. (a) GA-DAO complex headed for LYS, (b) GA-DAO complex headed for ARG, (c) TA-DAO complex headed for LYS, (d) TA-DAO complex headed for ARG and ASP.
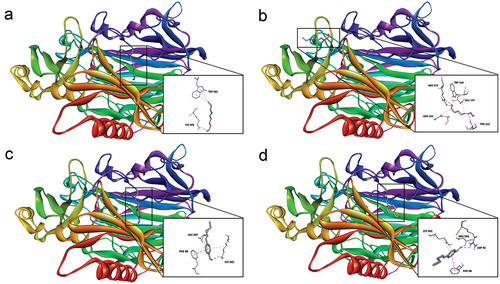
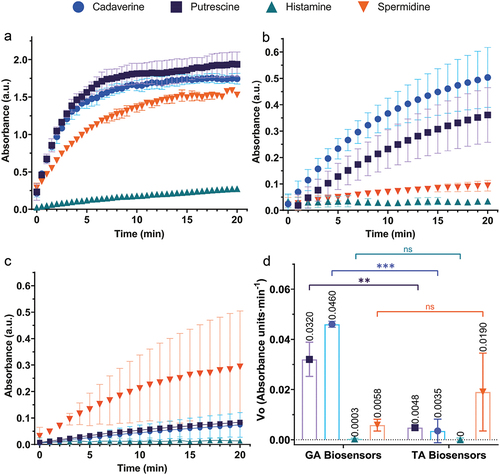
Figure 7. DAO activity, biosensor response to different BA, and comparison of initial velocity between GA and TA cross-linked biosensors. A, free DAO activity; B, GA biosensor responses; C, TA biosensor response; and D, initial velocities of GA and TA biosensor responses. Each point represents the average ± SD; error bars are not shown if smaller than the symbol. ns, not significant; **(p < .05); ***(p ≤ .0001); n = 3.