Figures & data
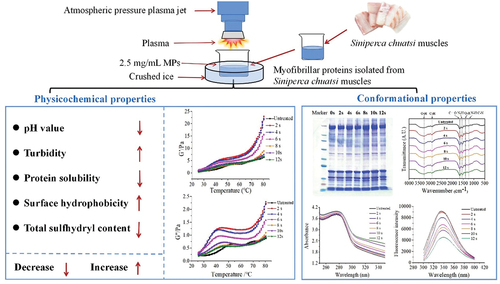
Figure 1. A schematic representation of APPJ used to treat MP extracted from Siniperca chuatsi. The equipment consists of a high-pressure generator (the power is 650 W), an air compressor, and a rotating plasma discharge nozzle.
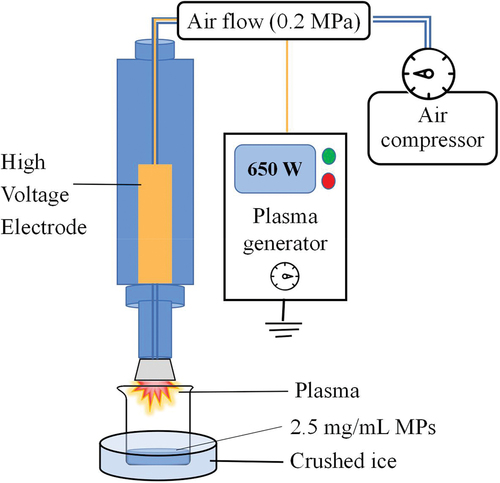
Figure 2. Changes in the physicochemical parameters of MP from Siniperca chuatsitr untreated and treated with APPJ. (a) pH, (b) Tolubility, (c) Turbidity, (d) MP sample treated by APPJ for 6–12 s. The results are expressed as ,with various letters on the top of the bar chart indicating significant differences (P < .05).
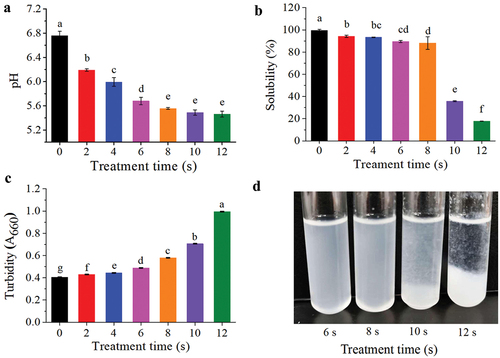
Figure 3. Influences of APPJ treatment on (a) Storage modulus (G´) Of mandarin fish MP, (b) Loss modulus (G”) Of mandarin fish MP.
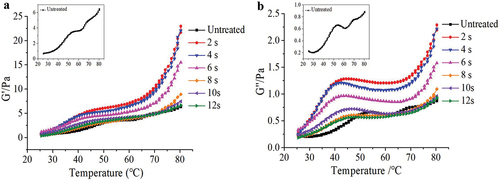
Figure 4. Electrophoresis pattern of MP extracted from Siniperca chuatsitr after different treatment times by APPJ (0-12s).
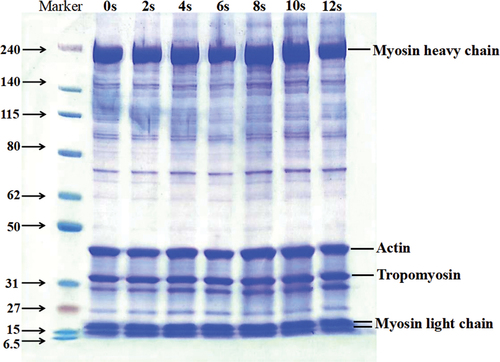
Figure 5. (a) FTIR spectra of MP by different APPJ treatment times; (b) Effects in secondary structure content of MP by different APPJ treatment times.
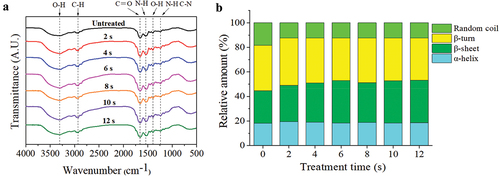
Figure 6. (a) Influences of APPJ treatment on the surface hydrophobicity of mandarin fish MP, (b) Influences of APPJ treatment on the total sulfhydryl content of mandarin fish MP. The findings are expressed as , with various letters on the top of the bars indicating significant differences (P < .05).
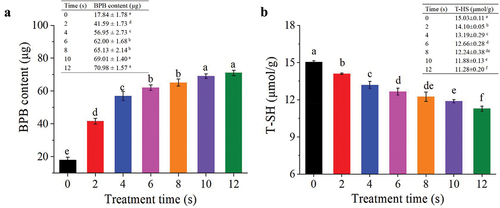
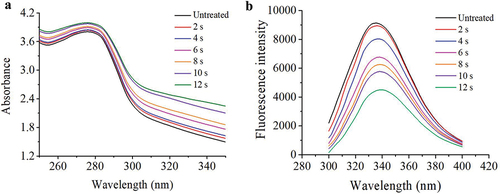
Figure 7. (a) UV absorption spectra of MP from mandarin fish exposed to different APPJ treatment times, (b) Intrinsic emission fluorescence spectra of MP from mandarin fish exposed to different APPJ treatment times.