Figures & data
Table 1. CCD response surface experimental design scheme and results.
Figure 1. Effects of different extraction parameters (a) enzyme activity, (b) pH, (c) temperature, (d) time, and (e) liquid-solid radio on extraction yield of polysaccharides and reducing sugars extracted by the method of ultrasonic-assisted enzymatic extraction (n = 3). Each factor was optimized consecutively while keeping rest of the factors constant. The initial constant values of the factors used during the analysis were extraction temperature of 50°C, pH 5.0, time of 2 h, liquid-solid ratio of 50 mL/g, and enzyme activity of 1000 U/g.
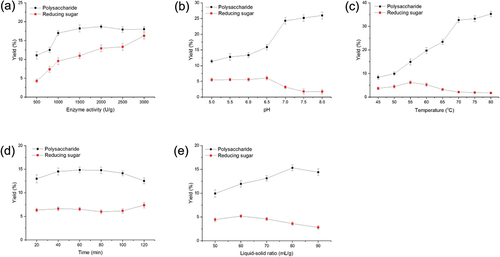
Table 2. ANOVA of the experimental results for DOP extraction yield.
Figure 2. Three-dimensional surfaces (A, B and C) and two-dimensional contour plots (a, b and c) showed effects of time, liquid-solid ratio and time on the yield of DOP.
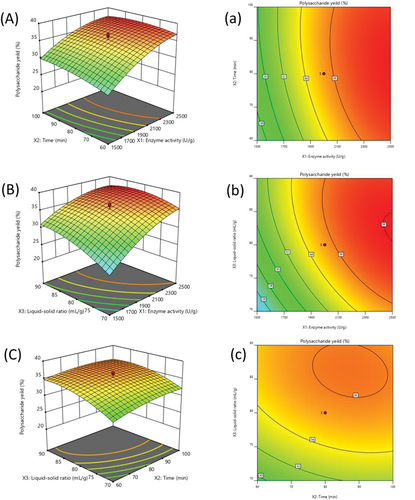
Table 3. Analysis of different extraction methods on DOP yield (%).
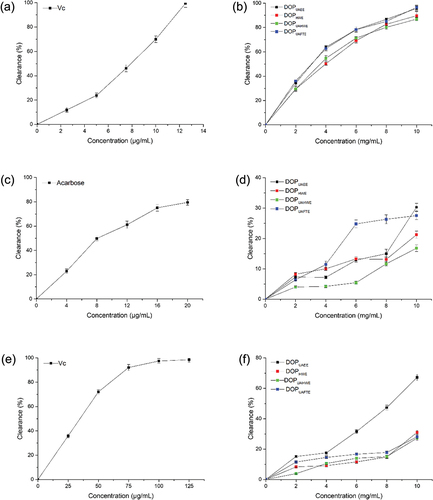
Figure 3. In vitro bioactivities of DOPs. (a), The ABTS clearance of Vc; (b), The ABTS clearance of DOPs; (c), Inhibition of acarbose on α-glucosidase; (d), Inhibition of DOPs on α-glucosidase; (e), Nitrite scavenging activity of Vc; (f), Nitrite scavenging activities of DOPs.