Figures & data
Table 1. Milk composition comparison of BBM and DBM.
Table 2. Determination of major differential metabolite compounds of BBM by UPLC-MS/MS.
Table 3. Determination of major differential metabolite compounds of DBM by UPLC-MS/MS.
Figure 1. Venn diagram of total identified protein numbers in BBM and DBM.
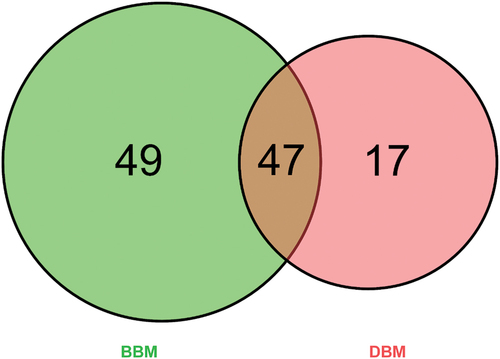
Figure 2. (a) RSD coefficient distribution before and after data correction of all the protein quantitative values in the corresponding sample. A lower CV coefficient indicated better repeatability of all samples. (b) Pearson correlation coefficient of all quantitative protein expressions between the two corresponding samples.
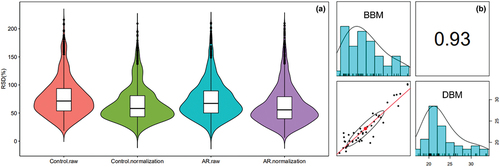
Figure 3. The distribution of enriched GO terms in BBM and DBM on three functional categories.
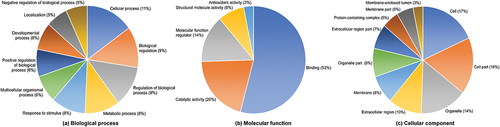
Figure 4. The distribution of enriched KEGG pathway in BBM and DBM.
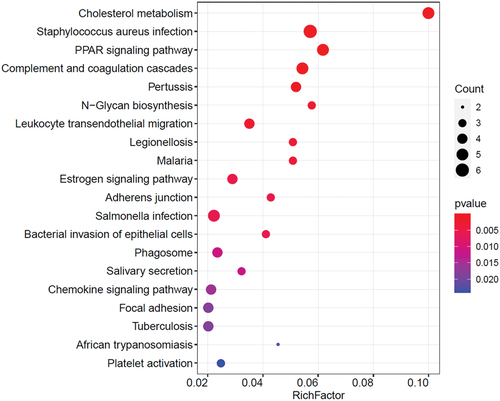
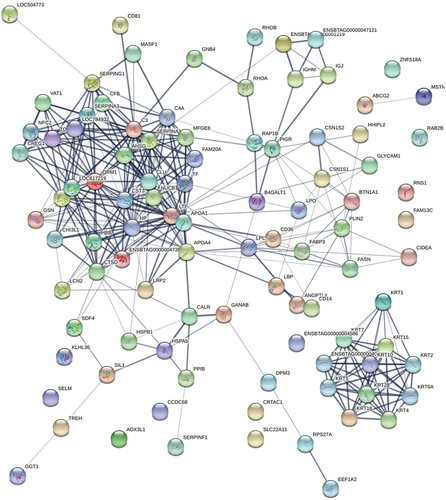
Figure 5. Ppis of the identified proteins in BBM and DBM. STRING database was used to establish the protein-protein interactions of quantified proteins identified by HPLC-MS/MS. Each node in the PPI network represents an identified protein, and the type of node represents the degree of connection of the protein.