417
Views
0
CrossRef citations to date
0
Altmetric
Research Article

The effects of propolis on doxorubicin-induced hepatorenal damage: a comparison of ethanolic and oily extracts of propolis

ORCID Icon, ORCID Icon, ORCID Icon & ORCID Icon
Pages 666-673 | Received 17 Jul 2023, Accepted 19 Oct 2023, Published online: 07 Nov 2023

Figures & data

Figure 1. Effects of the ethanolic propolis extract (PE) and oily propolis extract (PO) on oxidative stress status at the basal and DOX-induced conditions (PED, POD) in rat kidneys. Oxidative stress was evaluated by renal MDA level (a), GSH level (b), SOD activity (c) and CAT activity (d) in all groups. Results are expressed as mean ± SD (n = 6). Statistical difference from control *p < .01, **p < .001; from DOX # p < .001; from PE ϕp < .05, ϕϕp < .001; from PO θ p < .001; from ⊥ p < .05, ⊥⊥ p < .001 PED.
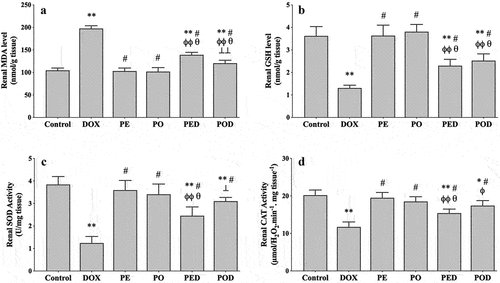
Figure 1. Effects of the ethanolic propolis extract (PE) and oily propolis extract (PO) on oxidative stress status at the basal and DOX-induced conditions (PED, POD) in rat kidneys. Oxidative stress was evaluated by renal MDA level (a), GSH level (b), SOD activity (c) and CAT activity (d) in all groups. Results are expressed as mean ± SD (n = 6). Statistical difference from control *p < .01, **p < .001; from DOX # p < .001; from PE ϕp < .05, ϕϕp < .001; from PO θ p < .001; from ⊥ p < .05, ⊥⊥ p < .001 PED.

Figure 2. Effects of the ethanolic propolis extract (PE) and oily propolis extract (PO) on oxidative stress status at the basal and DOX-induced conditions (PED, POD) in rat livers. Oxidative stress was evaluated by hepatic MDA level (a), GSH level (b), SOD activity (c) and CAT activity (d) in all groups. Results are expressed as mean ± SD (n = 6). Statistical difference from control *p < .001; from DOX # p < .001; from PE ϕp < .001; from PO θ p < .001; from PED ⊥ p < .01, ⊥⊥ p < .001.
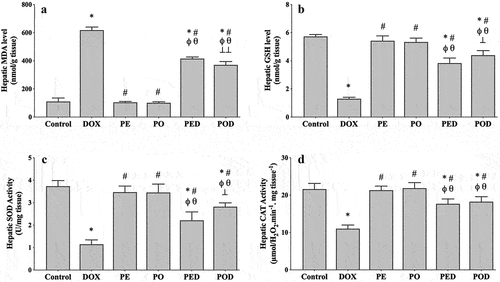
Figure 2. Effects of the ethanolic propolis extract (PE) and oily propolis extract (PO) on oxidative stress status at the basal and DOX-induced conditions (PED, POD) in rat livers. Oxidative stress was evaluated by hepatic MDA level (a), GSH level (b), SOD activity (c) and CAT activity (d) in all groups. Results are expressed as mean ± SD (n = 6). Statistical difference from control *p < .001; from DOX # p < .001; from PE ϕp < .001; from PO θ p < .001; from PED ⊥ p < .01, ⊥⊥ p < .001.

Table 1. Effects of the ethanolic propolis extract (PE) and oily propolis extract (PO) on serum and urinary parameters at the basal and DOX-induced conditions (PED, POD). Results are expressed as mean ± SD (n = 6).