
Figures & data
Table 1. RT-PCR primers used in this study.
Figure 1. Effect of theasaponin E1 on cell viability. (a) Molecular structure of theasaponin E1 (b)(c) theasaponin E1 is cytotoxic to C2C12 myotubes. Incubate cells with theasaponin E1 24, 48 hours, specified concentrations, 0, 8 μg/L, 16 μg/L, L, 32 μg/L, 64 μg/L, 128 μg/L, 150 μg/L; 200 μg/L. All data were expressed as mean ± S.D. *P < .05, **P < .01 represented statistical differences between the groups. All measurements are made in triplicate (n = 3).
Figure 2. Effects of saponin E1 on PI3K/AKT/mTOR signaling pathway. (a) Saposide E1 treated C2C12 cells for 1 h, 2 h, 4 h, 8 h, 16 h. (c) 1 μM/L insulin was used as positive control, and the cells were treated with 0, 15, 30, 45, 60, 100 μg/mL for 4 h, respectively. (b) (d) Quantitative determination of Akt phosphorylation levels in at least three independent experiments. (e). (g) C2C12 cells were treated with theasaponin E1 (30, 45, 60 μg/mL) for 4 H, and western blot clipping was displayed. (f) (h) quantitative western blot analysis was performed. The map also measured total PI3K/mTOR and beta-actin levels. Comparison of PI3K/mTOR mRNA expression levels between (i), (j) (k) and untreated cells All data were expressed as mean ± sd, *P < .05, **P < .01 was statistically significant difference between groups. All measurements are in triplicate (n = 3).
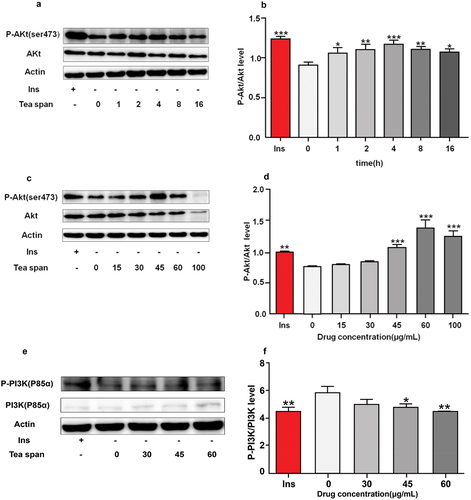
Figure 2 (Contiuned).
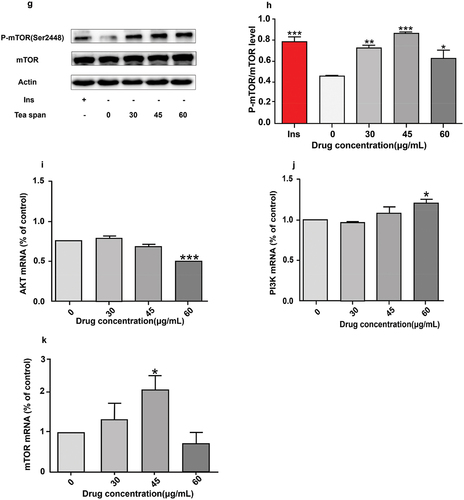
Figure 3. Effects of saponin E1 on glucose uptake in C2C12 cells. (a) (c) C2C12 cells were treated with (30, 45, 60 μg/mL) theasaponin E1 for 4 h and insulin 1 μM/L as positive control. (b) (d) Quantitative analysis of western blotting. The map also measures total AS160 and beta-actin levels as controls for protein load. (e) Incubate with 2-NBDG or 2-NDBG and different concentrations of saponin E1 for 4 min. All data were expressed as mean ± sd *P < .05, **P < .01 was statistically significant difference between groups. All measurements are in triplicate (n = 3).
Figure 4. Effect of theasaponin E1 on AMPK/ACC. (a) and (c) treatment of C2C12 cells with different theasaponin E1 concentrations for a specified period of time, metformin 2.5 mM as a positive control, showing a cropped image of AMPK/ACC Western blot, (b) and (d) P-ACC/ACC immunoblotting quantitative maps were analyzed, while the level of β-Actin was also measured as a control for protein loading. (e) and (f) AMPK, ACC expression levels of mRNA compared to untreated cells, All data were expressed as mean ±S.D. *P < .05, **P < .01 represented statistical differences between the groups. All measurements are made in triplicate (n = 3).
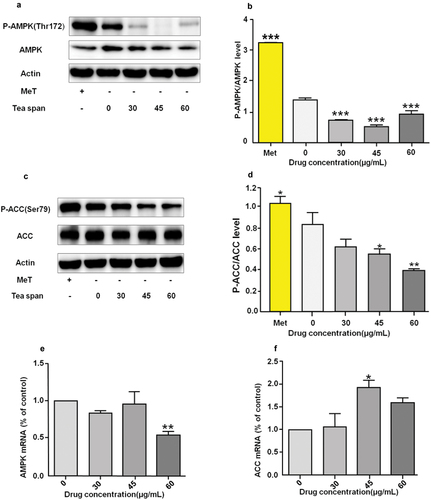
Figure 5. Effect of theasaponin E1 on GSK and P-70S6K. (a) and (c) treatment of C2C12 cells with different theasaponin E1 concentrations for a specified time, insulin 1 μM/L as a positive control, showing a cut-off image of GSK, P70S6K Western blot, (b) and (d) GSK, P70S6K immunization Blot analysis quantified the map while also measuring the level of β-Actin as a control for protein loading. All data were expressed as mean ± S.D. *P < .05, **P < .01 represented statistical differences between the groups.All measurements are made in triplicate (n = 3).
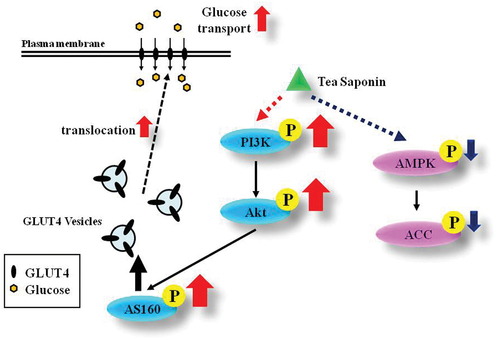
Figure 6. Theasaponin E1 proposes a glucose uptake mechanism through the activated PI3K/Akt/mTOR signaling pathway.
Data availability statement
Data available on request. The data underlying this article will be shared on reasonable request to the corresponding author.