
Figures & data
Figure 1. Caking of infant formula powders.
IF1, infant formula (for infants aged 0-6 months); IF2, follow-up infant formula (for infants aged 6-12 months); IF3, young children formula (for young children aged 12 to 36 months).
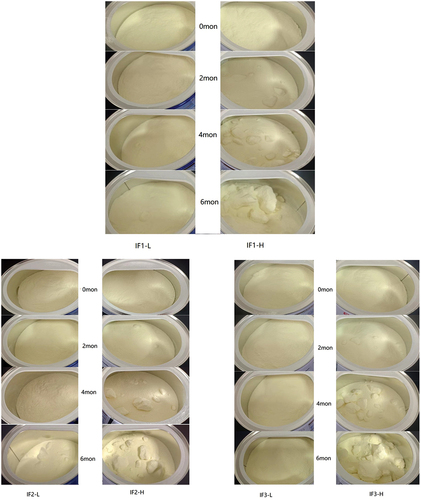
Figure 2. The water content (a) and water activity (b) of IFs storage.
One-way ANOVA test showed that only the IF3-H water content of the six groups of products had significant differences, with different letters indicating significant differences (p ≤ .05) in the figure for 0,2,4,6 months; Paired T-test showed that only the water activity of IF1-L and IF1-H in the six groups of products had a significant difference (p ≤ .05) at the sixth month, as indicated by * in the figure.
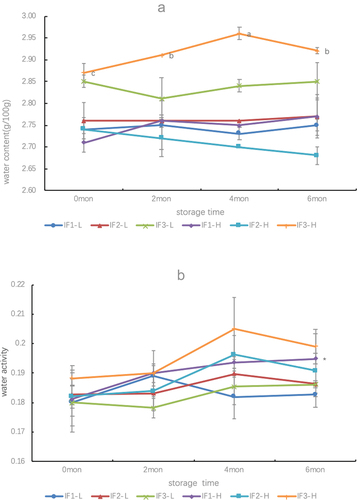
Table 1. Amino acid contents of infant formula (0–6-month old) stored at different storage time (mg/100 g).
Table 2. Amino acid contents of older infant formula (6–12- month old) stored at different storage time (mg/100 g).
Table 3. Amino acid contents of young children formula (12–24- month old) stored at different storage time (mg/100 g).
Table 4. HMF contents of IFs stored at different storage time (μg/100 g).
Figure 3. The colour difference (ΔE) of IFs storage.
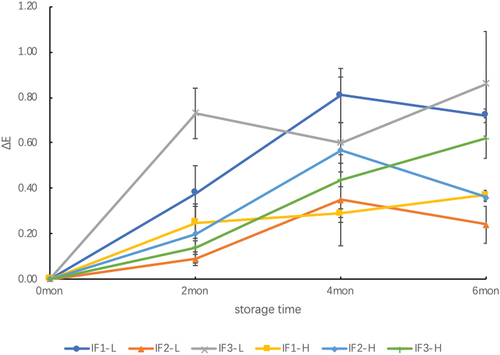
Table 5. The color changes of IFs stored at different storage time.