
Figures & data
Figure 1. Composition overview diagram of P. emblica L.
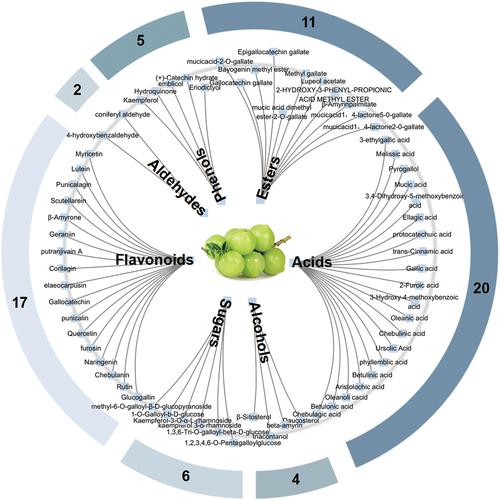
Figure 2. Diagram of the target analysis related to the composition of P. emblica L. (a) correlation plot of compositions and targets. Compositions with higher contributions are indicated in red, and the bar chart below corresponds to their degree values. Targets with higher contributions are shown in blue, and the right bars correspond to their degree values. (b) interaction diagram between targets. Targets with strong interactions are marked.
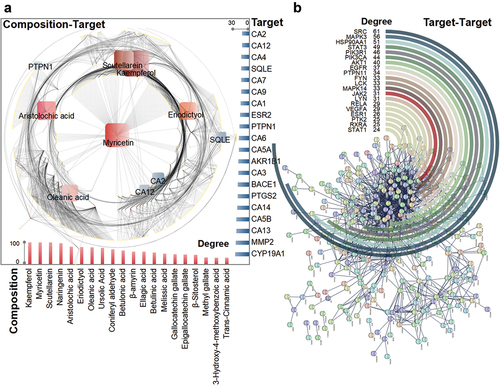
Figure 3. Diagram of the efficacy analysis related to the target of P. emblica L. (a) correlation plots of targets and efficacy. Targets with higher contributions are indicated in red, and the bar chart below corresponds to their degree values. Efficacy with higher contribution is shown in blue, and the right bars correspond to their degree values. (b) KEGG pathway enrichment plot of the target. (b) GO enrichment plot of the target. The three parts from left to right are shown as CC, BP and MF. Both GO and KEGG were enriched in the top 20.
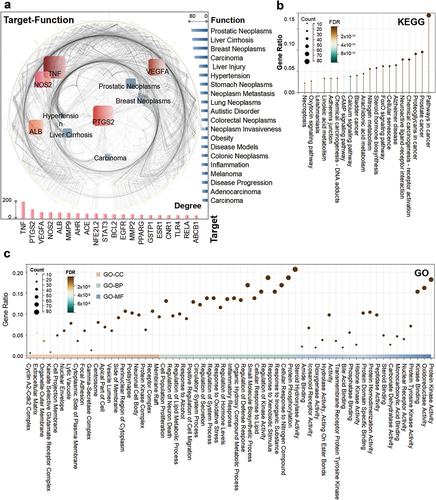
Figure 4. Multidimensional mining analysis diagram of P. emblica L. efficacy. (a) category clustering of efficacy. Left: number of efficacies encapsulated in different categories. Right: visual network of different efficacy-focused categories. (b) multiple venn diagram of cancer and other disease categories. The results are shown separately for clarity. (c) the alteration frequency of targets in different cancer cell lines.
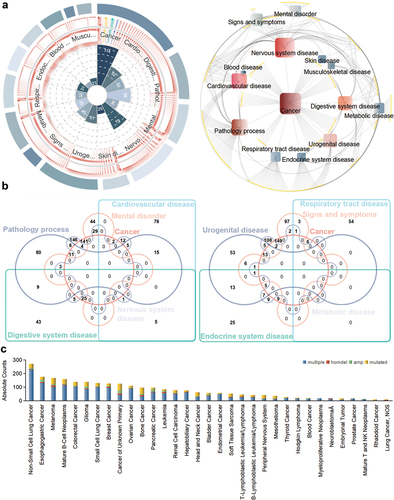
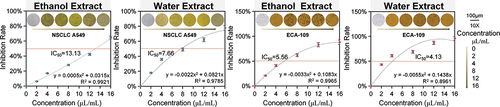
Figure 5. Inhibition rate of growth of non-small lung cancer cell A549 and esophageal cancer cell Eca-109 by the ethanol and water extracts of P. emblica L.
Supplemental Material
Download MS Word (518 KB)Supplemental Material
Download MS Word (21 KB)Data availability statement
All data generated or analysed during this study are included in this published article. The datasets used and analyzed in this study can be found in Supplementary Table.