Figures & data
Table 1. Factors and levels of L9(33) orthogonal experiment.
Figure 1. Effect of different extraction parameters on bound phenolic contents from Rosa roxburghii Tratt (RRT). (a) Effect of different acidolysis time on bound phenolic contents from RRT. (b) Effect of different concentration of HCl on bound phenolic contents from RRT. (c) Effect of solid-to-liquid ratio on bound phenolic contents from RRT. Different letters (a-d) indicated statistically significant differences (p < .05).
Table 2. Results and designs of orthogonal test.
Table 3. Analysis of orthogonal test.
Figure 2. Total ion chromatograms of RRT-BPs in negative ion mode based on LC-MS.
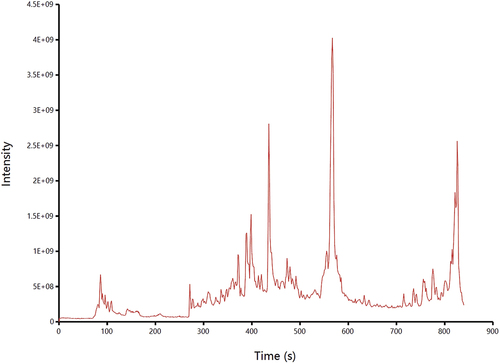
Table 4. The phenolic compositions of the acid hydrolysis bound phenols.
Figure 3. Antioxidant activities of RRT-BPs in vitro. (a) DPPH radical scavenging activity, (b) ABTS radical scavenging activity, (c) Ferric reducing antioxidant power assay. Different lowercase letters within the same concentration show differences between samples (p < .05). Different uppercase letters within the same sample indicate statistically significant differences (p < .05).
Figure 4. Inhibition of α-glucosidase by RRT-BPs. (a) Inhibitory effect of acarbose on α-glucosidase, (b) Inhibitory effect of RRT-BPs on α-glucosidase, (c) Reversibility of RRT-BPs mediated inhibition, (d) Lineweaver−Burk plots.
Figure 5. Inhibition of lipase by RRT-BPs. (a) inhibitory effect of orlistat on lipase, (b) inhibitory effect of RRT-BPs on lipase, (c) reversibility of RRT-BPs mediated inhibition, (d) Lineweaver−Burk plots.