
Figures & data
Figure 1. Graphical representation of scoring values in B-Cell epitopes prediction.
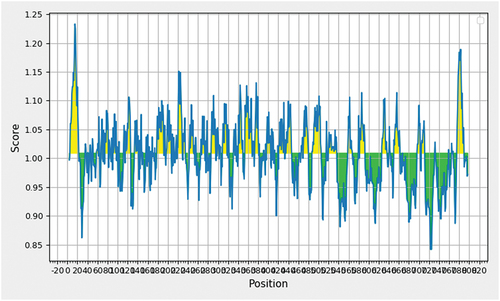
Table 1. Selected linear B-Cell epitopes for final vaccine construction.
Table 2. Selected MHC class-I and MHC class-II epitopes for vaccine construction.
Figure 2. Population coverage map by IEDB population coverage analysis tool.
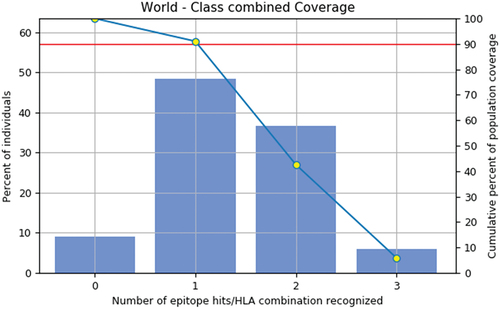
Figure 3. Vaccine construct map showing the sequences of linkers, adjuvant and epitopes.
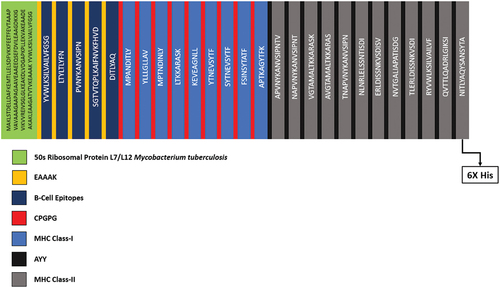
Figure 4. Predicted secondary structure of vaccine construct by PsiPred 2.0.
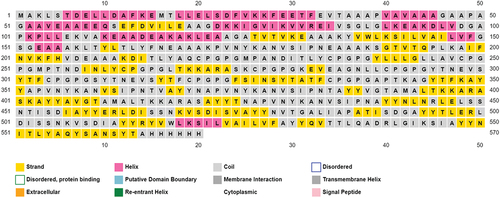
Figure 5. (a) predicted tertiary structure of the vaccine construct (B) predicted LDDT of the selected model 1.
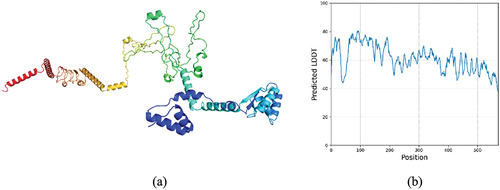
Figure 6. (a) ERRAT quality chart (b) Ramachandran Plot by ProCheck.
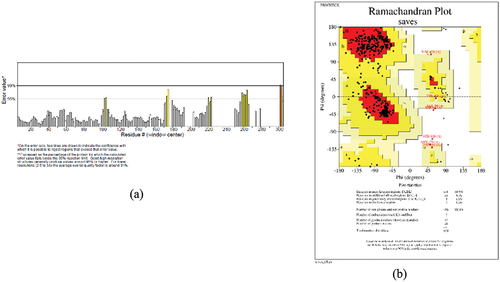
Figure 7. The docking complex of the vaccine construct and the receptor E-Cadherin visualized by PyMol visualization system.
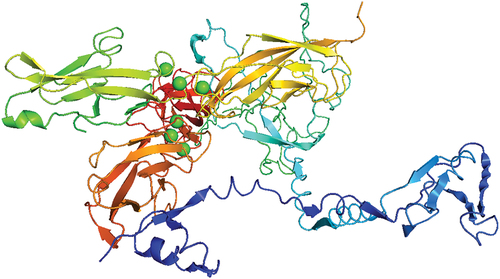
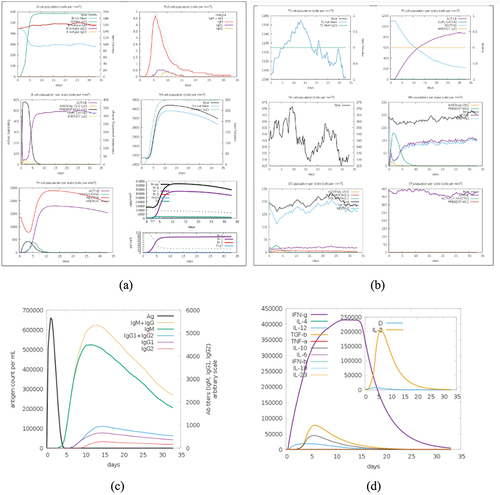
Figure 8. (a) cell counts shown. Legend: Act = active, Intern = internalized the ag, pres II = presenting on MHC II, Dup = in the mitotic cycle, anergic = anergic, resting = not active. (b) symbols as figure above. (c) the virus, the immunoglobulins and the immunocomplexes. (d) concentration of cytokines and interleukins. Inset plot shows danger signal together with leukocyte growth factor IL-2.
Data availability statement
All the data generated in this research work has been included in the manuscript.