Figures & data
Figure 1. Body weight of male (A) and female (B) mice treated with aqueous extract of NA over 14 days. Values are expressed as mean ± standard deviation. No significant differences (p > .05) were detected among the groups.
Table 1. Biochemical parameters of mice after subacute and acute oral administration of NA infusion. Values are presented as means ± standard deviation.
Figure 2. Histological sections of hematoxylin and eosin staining, as observed by optical microscopy. Liver sections showed well preserved hepatic cords and central vein (*). Intestine sections showed the mucosa with normal length villi. Kidney sections showed conserved glomeruli (circles) and tubules. Magnification 200 X.
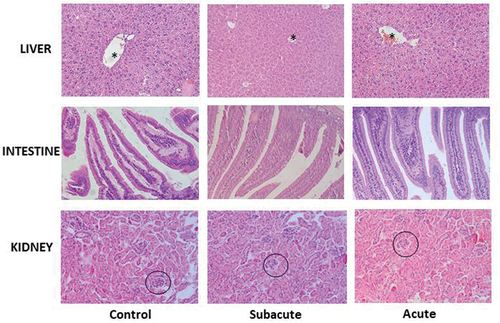
Table 2. Polyphenol, flavonoid content and antioxidant capacity of NA aqueous infusion. The infusion was obtained by boiling 5 g of leaves in 100 mL of water (5% w/v) and had a solid content of 10 mg/L.
Figure 3. Antioxidant activity of feces (A) and plasma (B) of mice treated with NA infusion. Asterisks indicate significant differences regarding the control.