Figures & data
Table 1. Single-factor experimental design.
Figure 1. Effects of (a) extraction temperature, (b) liquid-to-solid ratio, (c) extraction time, and (d) number of extraction rounds on polygonatum cyrtonema Hua polysaccharide (PCP) extraction yield. Data are shown as mean ± standard deviation (S.D.).
Table 2. Box – Behnken design and response value of polygonatum cyrtonema Hua polysaccharide (PCP) extraction.
Table 3. Analysis of variance (ANOVA) of a fitted response-surface quadratic polynomial model.
Figure 2. Response-surface three-dimensional (3D) plots and corresponding two dimensional (2D) contour plots of the effects of various variables on polygonatum cyrtonema Hua polysaccharide (PCP) yield.
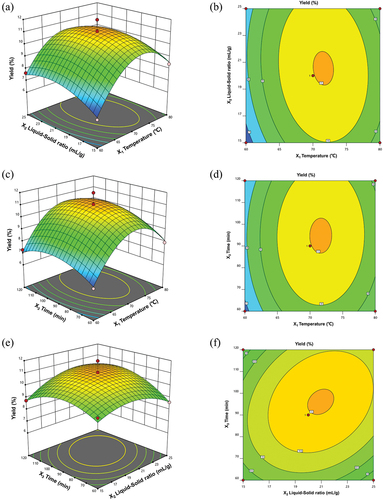
Figure 3. Isolation, purification, and homogeneity analysis of polygonatum cyrtonema Hua polysaccharide 1 (PCP1). (A) DEDE-52 elution curve, (b) sephadex-G-75 elution curve, and (c) high performance gel permeation chromatography (HPGPC) spectrogram.
Figure 4. In vitro antioxidant activity analysis of polygonatum cyrtonema Hua polysaccharide 1 (PCP1). (a) 1,1-diphenyl-2-picrylhydrazyl (DPPH) radical-scavenging activity. (b) Hydroxyl radical-scavenging activity. (c) 2, 2'-azino-bis 3-ethylbenzthiazo-line-6-sulfonic acid (ABTS) radical-scavenging activity. Data are shown as mean ± standard deviation (S.D.).
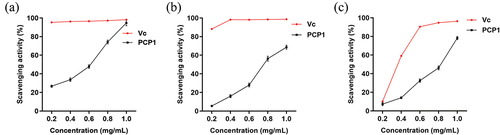
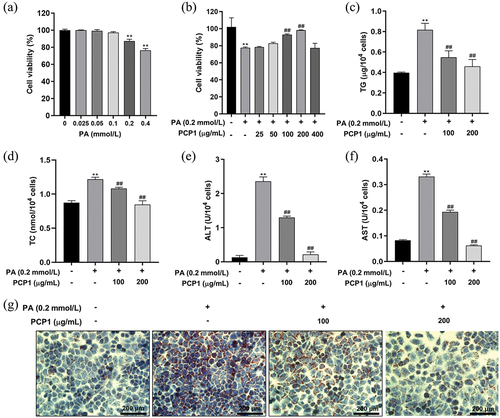
Figure 5. Lipid-lowering effect of polygonatum cyrtonema Hua polysaccharide 1 (PCP1) in vitro. (a) Effect of palmitic acid (PA) concentration on the activity of HepG2 cells. (b) Effect of PCP1 on the activity of HepG2 cells incubated with PA. (c) Intracellular triglycerides (TG) level. (d) Intracellular total cholesterol (TC) level. (e) Intracellular alanine transaminase (ALT) level. (f) Intracellular aspartate transaminase (AST) level. (g) Oil red O staining diagram. Data are shown as mean ± standard deviation (S.D.) **p < .01 versus normal group, ##p < .01 versus PA incubation group.