
Figures & data
Table 1. Pectin yield values obtained using different combinations of hydrogen bond acceptors and hydrogen bond donors.
Table 2. Effect of solid–liquid ratio on the pectin yield from onion peel powder using choline chloride and tartaric acid.
Table 3. Box-Behnken design with the experimental and predicted values of pectin yield (%) from onion peel powder.
Figure 1. Effect of single factor on pectin yield a) microwave intensity b) microwave duration c) ultrasound duration. Reported data are average values with error bars indicating the standard deviation of three replicates (n = 3).
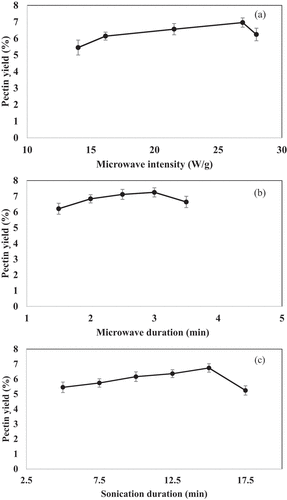
Table 4. ANOVA for the fitted second-order polynomial model of pectin yield (%) from onion peel powder.
Figure 2. (a) Comparison between predicted and actual values of pectin yield obtained by sequential microwave and ultrasound-assisted natural deep eutectic solvents-based extraction (b) normal probability of internally studentized residuals.
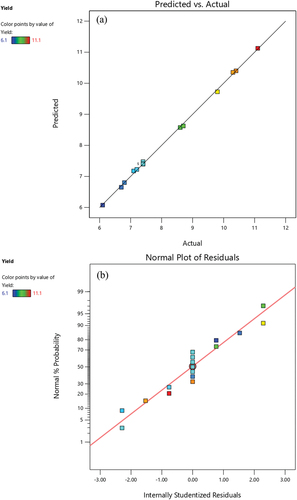
Figure 3. Three-dimensional response surface plots of pectin yield with three factors (a) microwave intensity vs. microwave duration (b) microwave intensity vs. sonication duration (c) microwave intensity vs. sonication duration.
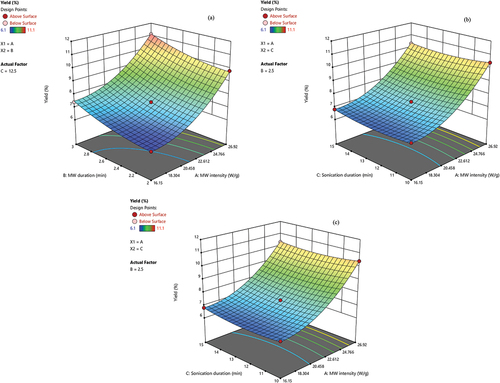
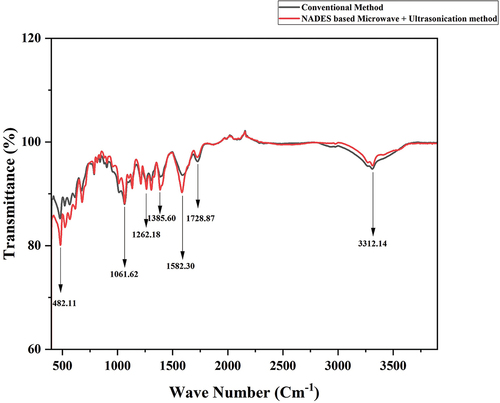
Figure 4. FTIR spectra of pectin samples extracted using NADES based microwave and ultrasound-assisted extraction method and using conventional method.
Data availability statement
The datasets generated during and/or analyzed during the current study are available within this article.