
Figures & data
Figure 1. Chemical structure of ribavirin.
Figure 2. The route of synthetic synthesis the hapten for ribavirin.
Figure 3. Structure of strips for immune chromatography.
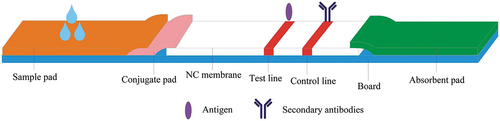
Figure 4. Illustration of typical test strip results.
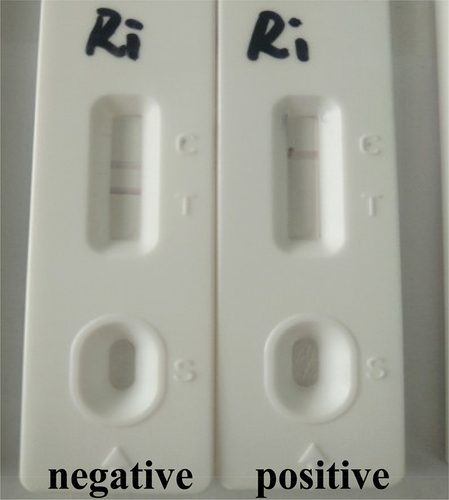
Figure 5. SDS-PAGE of carrier proteins and conjugates(Lane 1: ri-BSA 5-fold dilution; Lane 2: ri-BSA 2-fold dilution; Lane 3: BSA 5-fold dilution; Lane 4: BSA 2-fold dilution).
Figure 6. Inhibition curve of Ri competitive and Ri competitive in pig urine samples.
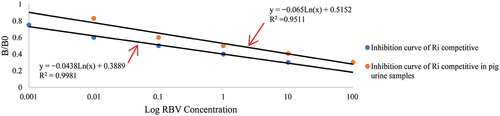
Table 1. Cross-reactivity of other drugs/metabolites with the monoclonal antibody.
Table 2. The rate of recovery of the sample using ELISA.
Table 3. The relation of particle size and amount of sodium citrate added.
Figure 7. Images of the RBV analysis using the GCI strip assay in PBS (1 = 0, 2 = 1 ng/mL, 3 = 2 ng/mL, 4 = 3 ng/mL, 5 = 5 ng/mL).
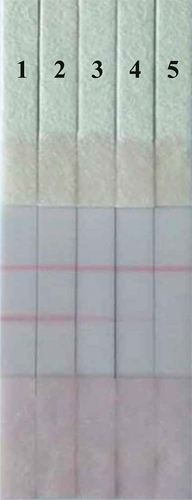
Table 4. The repeatability of the colloidal gold strip.