Figures & data
Figure 1. The flow diagram of probiotic yogurt production with bee pollen.
Figure 2. Antimicrobial activity of yogurt samples (inhibition zones mm). n = 4, ┬ ┴ standard deviations. Control: probiotic yogurt without bee pollen, 0.5%: probiotic yogurt containing 0.5% bee pollen, 1.5%: probiotic yogurt containing 1.5% bee pollen, 3%: probiotic yogurt containing 3% bee pollen, 6%: probiotic yogurt containing 6% bee pollen.
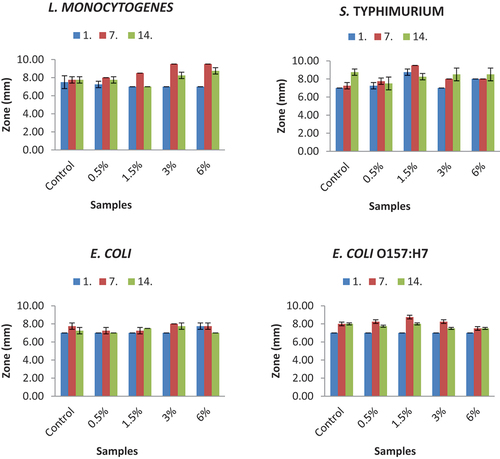
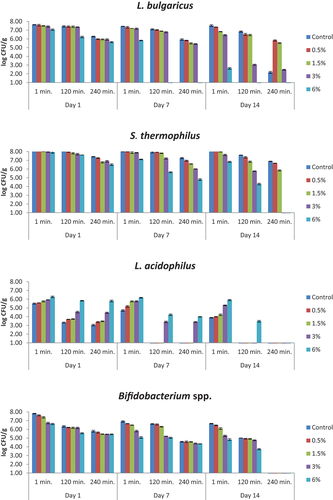
Figure 3. The viability of yogurt starter culture in simulated gastric juice adjusted to pH 2 (log CFU/g). n = 4, ┬ ┴ standard deviations. Control: probiotic yogurt without bee pollen, 0.5%: probiotic yogurt containing 0.5% bee pollen, 1.5%: probiotic yogurt containing 1.5% bee pollen, 3%: probiotic yogurt containing 3% bee pollen, 6%: probiotic yogurt containing 6% bee pollen.
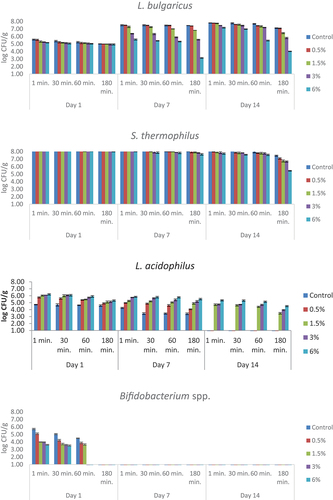
Figure 4. The viability of yogurt starter culture in simulated gastric juice adjusted to pH 3 (log CFU/g). n = 4, ┬ ┴ standard deviations. Control: probiotic yogurt without bee pollen, 0.5%: probiotic yogurt containing 0.5% bee pollen, 1.5%: probiotic yogurt containing 1.5% bee pollen, 3%: probiotic yogurt containing 3% bee pollen, 6%: probiotic yogurt containing 6% bee pollen.
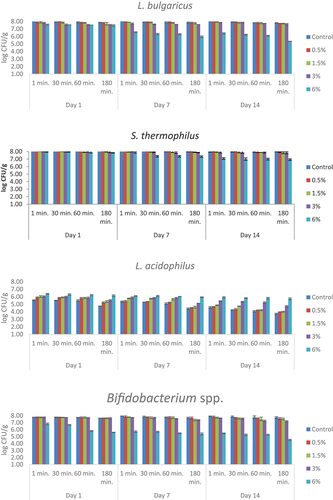
Figure 5. The viability of yogurt starter culture in simulated gastric juice adjusted to pH 4 (log CFU/g). n = 4, ┬ ┴ standard deviations. Control: probiotic yogurt without bee pollen, 0.5%: probiotic yogurt containing 0.5% bee pollen, 1.5%: probiotic yogurt containing 1.5% bee pollen, 3%: probiotic yogurt containing 3% bee pollen, 6%: probiotic yogurt containing 6% bee pollen.
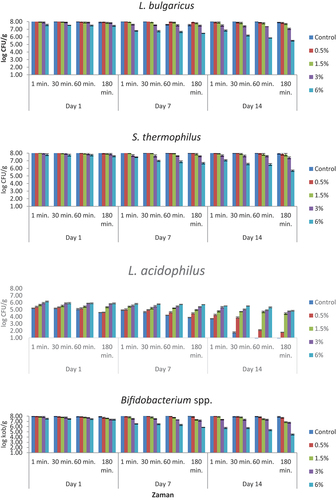
Figure 6. The viability of yogurt starter culture in simulated small intestinal juices that contained bile salts (log CFU/g). n = 4, ┬ ┴ standard deviations. Control: probiotic yogurt without bee pollen, 0.5%: probiotic yogurt containing 0.5% bee pollen, 1.5%: probiotic yogurt containing 1.5% bee pollen, 3%: probiotic yogurt containing 3% bee pollen, 6%: probiotic yogurt containing 6% bee pollen.
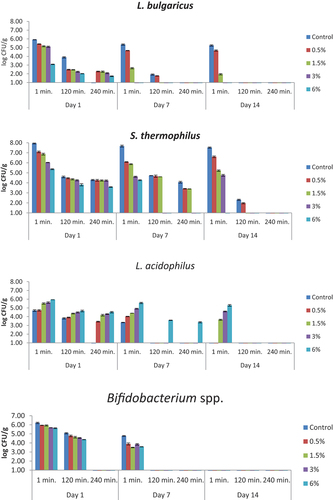
Figure 7. The viability of yogurt starter culture in simulated small intestinal juices which were free of bile salts (log CFU/g). n = 4, ┬ ┴ standard deviations. Control: probiotic yogurt without bee pollen, 0.5%: probiotic yogurt containing 0.5% bee pollen, 3%: probiotic yogurt containing 3% bee pollen, 6%: probiotic yogurt containing 6% bee pollen.