Figures & data
Table 1. Consumer behaviour questions.
Table 2. Factors affecting consumers’ perceptions of cricket and cricket powder.
Table 3. Results of the demographics of Thai and Chinese consumers.
Table 4. T-Test results of six factors influencing both Thai and Chinese consumer perception.
Figure 1. Emotional responses (a: positive emotion and b: negative emotion) of Thai vs. Chinese consumers regarding the perception of the different types of cricket products.
TH = Thai consumers, CH= Chinese consumers, CS= Original cricket structure, and PP = Processed cricket products.
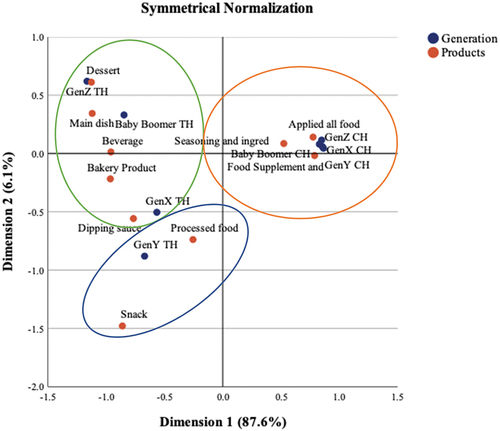
Figure 2. Correspondence analysis (CA) plots between ten categories of food products and four generations of Thai and Chinese consumers2.
1Ten categories of food products, including main dish, dessert, bakery product, beverage, dipping sauce, snack, seasoning and ingredient, food supplement and functional food, processed food, and applied in all types of products.2 CH is Chinese consumers, and TH is Thai consumers.