Figures & data
Table 1. Formulation of chocolate beverages with different levels of encapsulated clove bud extract.
Table 2. Total phenolic content of chocolate beverages with different formulations.
Table 3. Total flavonoid content of chocolate beverages with different formulations.
Table 4. Antioxidant activity as IC₅₀ (ppm) of chocolate beverages with different formulations.
Table 5. Characteristics of powdered chocolate beverages (before brewing).
Table 6. Characteristics of chocolate beverages (after brewing).
Figure 1. Sensory evaluation scores of chocolate beverages with different formulations.
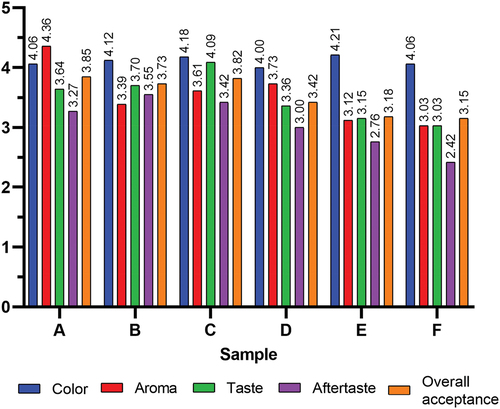
Figure 2. Chocolate beverages with different formulations.
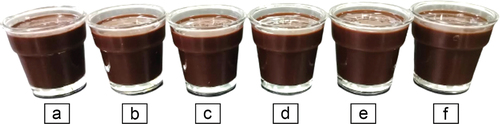
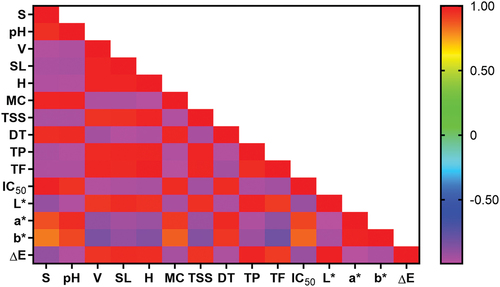
Figure 3. Pearson’s correlation coefficient between variables (r). S (sedimentation), pH (power of hydrogen), V (viscosity), SL (solubility), H (hygroscopicity), MC (moisture content), TSS (total soluble solids), DT (dissolution time), TP (total phenolic), TF (total flavonoids), IC₅₀ (inhibitory concentration 50%), L* (lightness), a* (redness), b* (yellowness), and ∆E (total color difference).