Figures & data
Figure 1. Schematic diagram of the experimental low-temperature plasma generator.
Figure 2. Schematic diagram of the vacuum chamber.
Table 1. Levels of independent variables chosen for the experimental design.
Table 2. Box–Behnken design: effects of process variables on decontamination effect parameters.
Table 3. Results obtained in the assays for validation of the conditions optimized for low-temperature plasma decontamination of corn kernels.
Figure 3. Predicted values versus experimental values of A. flavus counts.
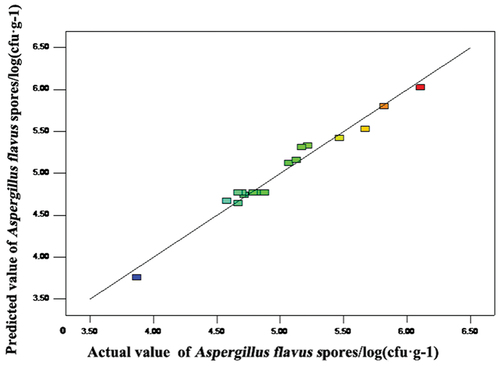
Figure 4. Response surface of the independent variables on A. flavus counts.
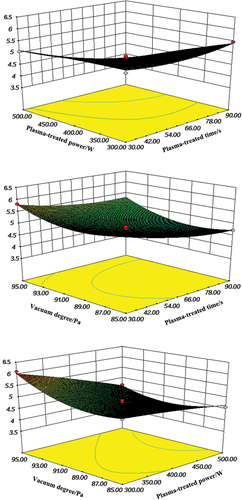
Figure 5. Effects of plasma treatment on the extracellular conductivity of A. flavus.
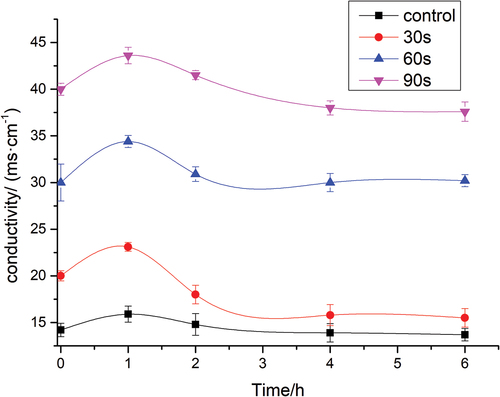
Figure 6. The changes of (a) SOD and (b) CAT activity after different plasma-treated time.
Figure 7. A schematic of plasma sterilization mechanism on antioxidant enzyme.
Figure 8. Effect of different durations of plasma-treated time on the values of MDA.
Figure 9. SEM images of the surface of control and low-temperature, plasma-treated A. flavus spores. (a) Control , (b) 300 W-30 s, (c) 400 W-30 s, and (d) 500 W-30 s. 1, change in the shape of cells; 2, disruption of spore’s coat; and 3, spore debris due to the bursting of spores.