
Figures & data
Figure 1. Illustration of the proposed sweetener identification method.
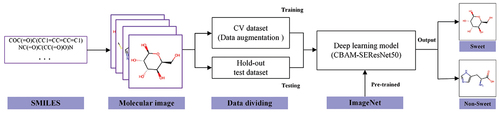
Table 1. Description of the collected dataset.
Figure 2. Molecular images in the dataset categorized as sweet and non-sweet (bitter, tasteless) compounds.
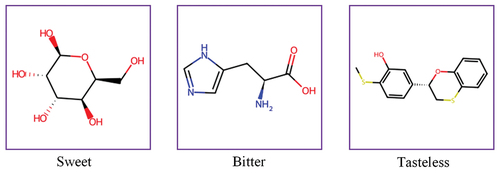
Figure 3. Data augmentation.
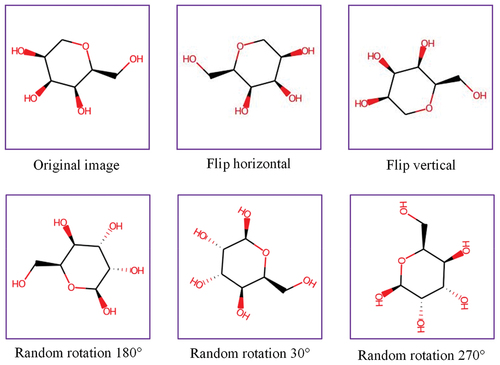
Figure 4. Sweetener identification based on CBAM-SEResNet-50.
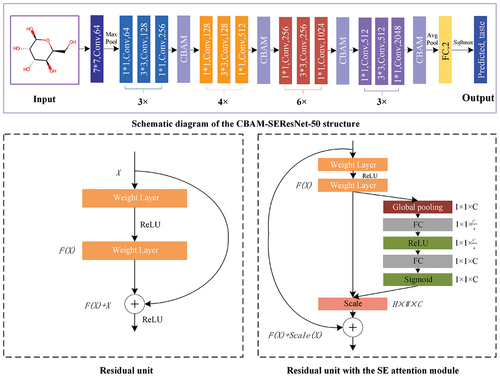
Table 2. The architecture of ResNet-50.
Figure 5. The network structure of SE attention module.
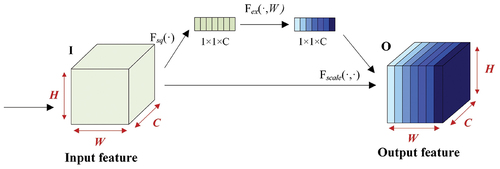
Figure 6. The network structure of CBAM attention module.
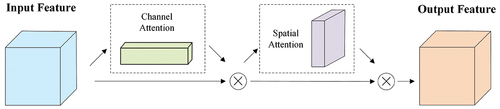
Table 3. Parameter setting.
Figure 7. Comparing the AUROC values of the transfer learning model ResNet-50 with different attention mechanisms.
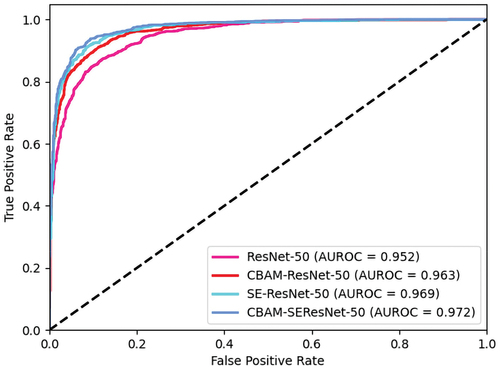
Table 4. Comparison of the transfer learning model ResNet-50 with different attention mechanisms.
Figure 8. Confusion matrices of different sweetener identification models.
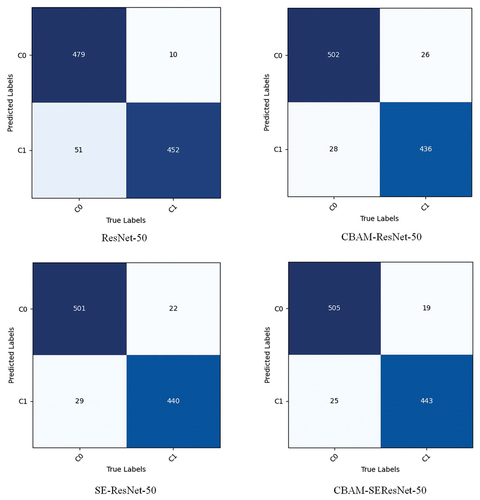
Figure 9. Comparison of AUROC values for different transfer learning driven sweetener identification algorithms.
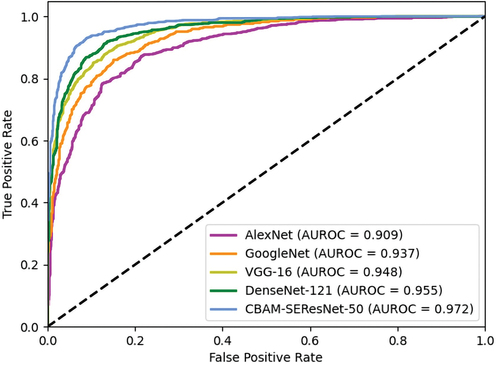
Table 5. Comparison of different transfer learning driven sweetener identification models.
Table 6. Comparison with previous sweetener identification methods.
Figure 10. Visualization of the convolutional layers, maximum-pooling layers, and residual layers in the CBAM-SEResNet-50 model.
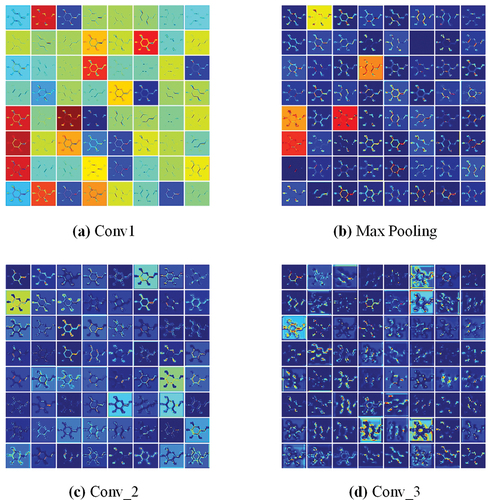
Figure 11. Visualizing the regions of interest (ROI) of sweet molecule images with hydroxyl groups.
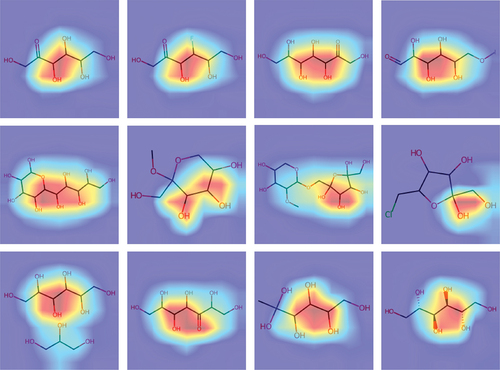
Figure 12. Visualizing the ROI of sweet molecule images with carbonyl and amino groups.
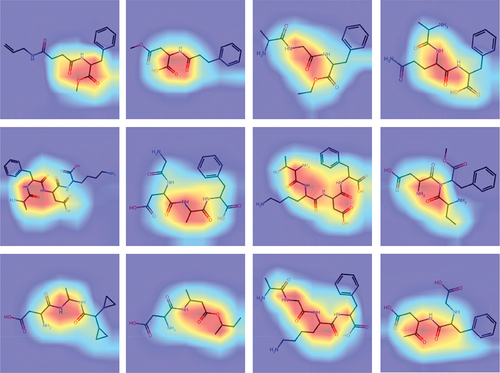
Table 7. The similarity threshold, the number of compounds outside AD for each threshold, and the corresponding AUROC value.
Table 8. Sweetener identification applications of CBAM-SEResNet-50 on different datasets.
Table 9. The identification results of the CBAM-SEResNet-50 model on a multi-taste molecule dataset.