
Figures & data
Figure 1. Effects of UA, STH, STH-M and STH-M-S on the viability, morphology and cell cycle of HK-2 cells. (a–e), effects of UA, STH, STH-M and STH-M-S on viability of HK-2 cell (n = 6). Different letters in the column mean significant difference (p < .05). (a) dose-dependent cytotoxicity of UA: cells were treated with 1.8–18.2 mM UA for 24 h. (b) time-dependent cytotoxicity of UA: cells were treated with 4.0 mM UA for 12–48 h. (c) effect of STH on cell viability: cells were treated with 0.1–6.4 mg/mL STH for 24 h. (d) effect of STH-M on cell viability: cells were treated with 0.025–1.6 mg/mL STH-M for 24 h. (e) effect of STH-M-S on cell viability: cells were treated with 0.025–1.6 mg/mL STH-M-S for 24 h. (f–g), protective effects of different concentrations of STH-M and STH-M-S on uric acid-induced HK-2 cell damage on the morphological characteristics and cell viability. (f) the viability of HK-2 cells. Data are plotted as mean ± SD (n = 6). The same letter means no significant difference. (g) cell morphology was observed using an optical microscope at a magnification of 40×. Red arrows indicate apoptotic cells and yellow arrows indicate urate crystals. UA+ STH-M LD group: cells were treated with 0.06 mg/mL STH-M, UA+ STH-M HD group: cells were treated with 0.10 mg/mL STH-M, UA+ STH-M-S LD group: cells were treated with 0.13 mg/mL STH-M, UA+ STH-M-S HD group: cells were treated with 0.26 mg/mL STH-M-S. (h) Cell cycle analysis performed after 24 h of treatment with uric acid and 0.1 mg/mL STH-M and 0.26 mg/mL STH-M-S (after 24 h of uric acid treatment). The same letter means no significant difference (n = 3).
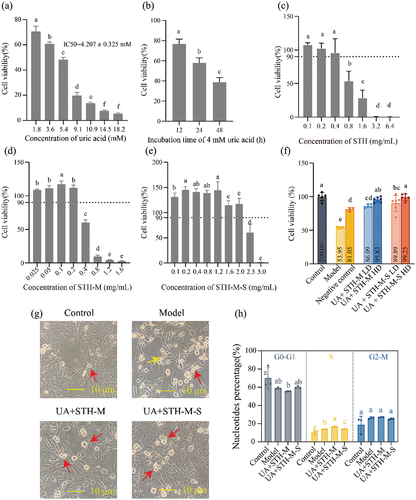
Figure 2. Effects of treatment with STH-M and STH-M-S on the apoptosis of HK-2 cells exposed to uric acid. (a) control group. (b) cells were treated with 4.207 mM uric acid for 24 h. (c) cells were treated with 4.207 mM uric acid for 24 h and then treated with 0.1 mg/mL STH-M for 24 h. (d) cells were treated with 4.207 mM uric acid for 24 h and then treated with 0.26 mg/mL STH-M-S for 24 h. (e) Percentage of apoptotic cells.
Figure 3. The number of differentially expressed genes in each comparison followed by the interaction venn diagram analyses among these comparisons (a) and. The gene expression levels assessed by qRT-PCR (b). **means the significant difference between-in the two groups for the gene, and nsmeans no significant difference.
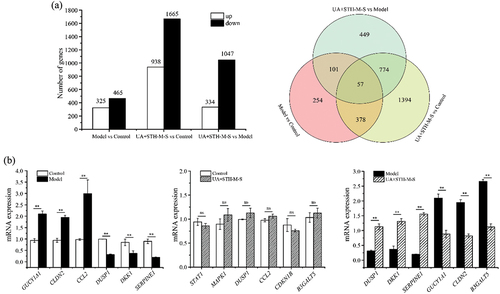
Table 1. The shared differentially expressed genes information among different comparisons.