241
Views
0
CrossRef citations to date
0
Altmetric
Research Article

The effects of highly bioavailable curcumin in downhill running-induced muscle damage model

, , , &
Article: 2353320 | Received 21 Feb 2024, Accepted 05 May 2024, Published online: 20 May 2024

Figures & data

Table 1. Change of body weight of mice.

Table 2. DNA primers for real-time RT-PCR.

Figure 1. Antioxidant effect of TS-P1 and CR-033P in vitro (a, b) measurement of scavenging activity of TS-P1 (a) and CR-033P (b) against DPPH radical. Ascorbic acid (AA) is used as a positive control. (c, d) measurement of ferric reducing antioxidant power (FRAP) of TS-P1 (c) and CR-033P (d). (e, f) measurement of total antioxidant capacity (TAC) of TS-P1 (e) and CR-033P (f). Data were expressed as mean ± SEM (n = 3, *p < .05, **p < .01, ***p < .001 vs untreated group by one-way ANOVA using Dunnett’s multiple comparison test for TS-P1 and CR-033P; n = 3, ***p < .001 vs untreated group by t-test for AA).
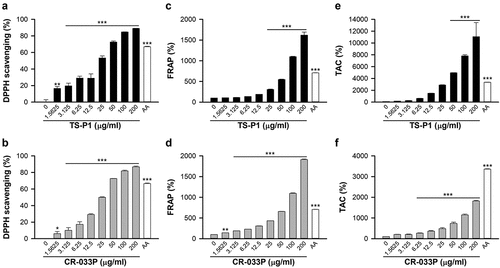
Figure 1. Antioxidant effect of TS-P1 and CR-033P in vitro (a, b) measurement of scavenging activity of TS-P1 (a) and CR-033P (b) against DPPH radical. Ascorbic acid (AA) is used as a positive control. (c, d) measurement of ferric reducing antioxidant power (FRAP) of TS-P1 (c) and CR-033P (d). (e, f) measurement of total antioxidant capacity (TAC) of TS-P1 (e) and CR-033P (f). Data were expressed as mean ± SEM (n = 3, *p < .05, **p < .01, ***p < .001 vs untreated group by one-way ANOVA using Dunnett’s multiple comparison test for TS-P1 and CR-033P; n = 3, ***p < .001 vs untreated group by t-test for AA).

Figure 2. Muscle-protective effect of TS-P1 and CR-033P in mouse DHR model. (a) Experimental scheme of mouse DHR model. For two days, mice were trained to run on flat treadmill for 10 min per day, and then subjected to DHR after 1 day resting. (b, c) measurement of activities of lactate dehydrogenase (LDH) (b) and creatine kinase (CK) (c) in plasma of mice treated with or without saline, TS-P116.7, TS-P150, CR-033P16.7, CR-033P50, and curcumin50. Data were expressed as mean ± SEM (n = 8, *p < .05 for resting and p < .05 for saline by t-test).

Figure 2. Muscle-protective effect of TS-P1 and CR-033P in mouse DHR model. (a) Experimental scheme of mouse DHR model. For two days, mice were trained to run on flat treadmill for 10 min per day, and then subjected to DHR after 1 day resting. (b, c) measurement of activities of lactate dehydrogenase (LDH) (b) and creatine kinase (CK) (c) in plasma of mice treated with or without saline, TS-P116.7, TS-P150, CR-033P16.7, CR-033P50, and curcumin50. Data were expressed as mean ± SEM (n = 8, *p < .05 for resting and †p < .05 for saline by t-test).
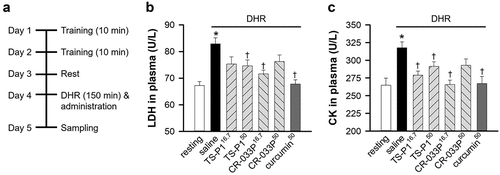
Figure 3. Antioxidant effect of TS-P1 and CR-033P upon DHR-induced oxidative stress (a, b) measurement of levels of hydrogen peroxide (H2O2) (a) and malondialdehyde (MDA) (b) in gastrocnemius muscle (GA) of mice treated with or without saline, TS-P116.7, TS-P150, CR-033P16.7, CR-033P50, and curcumin50. Data were expressed as mean ± SEM (n = 8, *p < .05 for resting by t-test). (c) Relative level of mRNA of Nox2 in GA of mice treated with or without saline, TS-P116.7, TS-P150, CR-033P16.7, CR-033P50, and curcumin50. Data were expressed as mean ± SEM (n = 8, *p < .05 for resting and †p < .05 for saline by t-test). (d, e) measurement of activities of glutathione peroxidase (GPx) (D) and catalase (E) in GA of mice treated with or without saline, TS-P116.7, TS-P150, CR-033P16.7, CR-033P50, and curcumin50. Data were expressed as mean ± SEM (n = 8, *p < .05 for resting and p < .05 for saline by t-test).
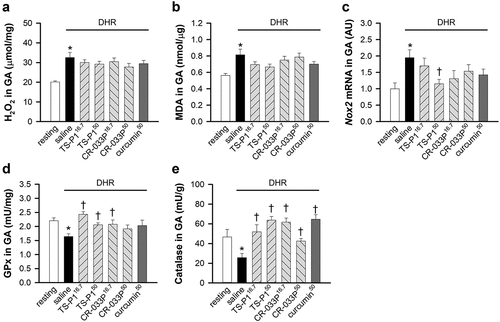
Figure 3. Antioxidant effect of TS-P1 and CR-033P upon DHR-induced oxidative stress (a, b) measurement of levels of hydrogen peroxide (H2O2) (a) and malondialdehyde (MDA) (b) in gastrocnemius muscle (GA) of mice treated with or without saline, TS-P116.7, TS-P150, CR-033P16.7, CR-033P50, and curcumin50. Data were expressed as mean ± SEM (n = 8, *p < .05 for resting by t-test). (c) Relative level of mRNA of Nox2 in GA of mice treated with or without saline, TS-P116.7, TS-P150, CR-033P16.7, CR-033P50, and curcumin50. Data were expressed as mean ± SEM (n = 8, *p < .05 for resting and †p < .05 for saline by t-test). (d, e) measurement of activities of glutathione peroxidase (GPx) (D) and catalase (E) in GA of mice treated with or without saline, TS-P116.7, TS-P150, CR-033P16.7, CR-033P50, and curcumin50. Data were expressed as mean ± SEM (n = 8, *p < .05 for resting and †p < .05 for saline by t-test).

Figure 4. Anti-inflammatory effect of TS-P1 and CR-033P upon DHR. (a-c) measurement of relative levels of mRnas of Il1b (a), Il6 (b), and tnfa (c), coding pro-inflammatory cytokines IL-1β, IL-6 and TNFα respectively, in GA of mice treated with or without saline, TS-P116.7, TS-P150, CR-033P16.7, CR-033P50, and curcumin50. Data were expressed as mean ± SEM (n = 8, *p < .05 for resting and †p < .05 for saline by Mann – Whitney rank sum test). (d) Measurement of relative level of mRNA of Il10, coding IL-10, in GA of mice treated with or without saline, TS-P116.7, TS-P150, CR-033P16.7, CR-033P50, and curcumin50. Data were expressed as mean ± SEM (n = 8, *p < .05 for resting and †p < .05 for saline by Mann – Whitney rank sum test). (e) Measurement of relative levels of mRnas of Ptgs2, coding COX-2, in GA of mice treated with or without saline, TS-P116.7, TS-P150, CR-033P16.7, CR-033P50, and curcumin50. Data were expressed as mean ± SEM (n = 8, *p < .05 for resting and p < .05 for saline by Mann – Whitney rank sum test).
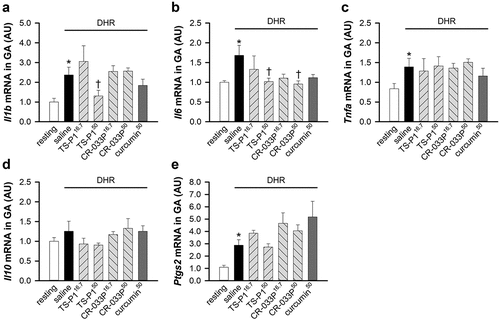
Figure 4. Anti-inflammatory effect of TS-P1 and CR-033P upon DHR. (a-c) measurement of relative levels of mRnas of Il1b (a), Il6 (b), and tnfa (c), coding pro-inflammatory cytokines IL-1β, IL-6 and TNFα respectively, in GA of mice treated with or without saline, TS-P116.7, TS-P150, CR-033P16.7, CR-033P50, and curcumin50. Data were expressed as mean ± SEM (n = 8, *p < .05 for resting and †p < .05 for saline by Mann – Whitney rank sum test). (d) Measurement of relative level of mRNA of Il10, coding IL-10, in GA of mice treated with or without saline, TS-P116.7, TS-P150, CR-033P16.7, CR-033P50, and curcumin50. Data were expressed as mean ± SEM (n = 8, *p < .05 for resting and †p < .05 for saline by Mann – Whitney rank sum test). (e) Measurement of relative levels of mRnas of Ptgs2, coding COX-2, in GA of mice treated with or without saline, TS-P116.7, TS-P150, CR-033P16.7, CR-033P50, and curcumin50. Data were expressed as mean ± SEM (n = 8, *p < .05 for resting and †p < .05 for saline by Mann – Whitney rank sum test).

Figure 5. Inhibitory effect of TS-P1 and CR-033P on macrophage activation upon DHR. (a-c) measurement of relative levels of mRnas of Mcp1 (a), Cxcl14 (b), and Adgre1 (c), which are genes involved in macrophagic activation, in GA of mice treated with or without saline, TS-P116.7, TS-P150, CR-033P16.7, CR-033P50, and curcumin50. Data were expressed as mean ± SEM (n = 8, *p < .05 for resting and †p < .05 for saline by Mann – Whitney rank sum test).

Figure 5. Inhibitory effect of TS-P1 and CR-033P on macrophage activation upon DHR. (a-c) measurement of relative levels of mRnas of Mcp1 (a), Cxcl14 (b), and Adgre1 (c), which are genes involved in macrophagic activation, in GA of mice treated with or without saline, TS-P116.7, TS-P150, CR-033P16.7, CR-033P50, and curcumin50. Data were expressed as mean ± SEM (n = 8, *p < .05 for resting and †p < .05 for saline by Mann – Whitney rank sum test).

Data availability statement

The raw datasets used and/or analyzed are available from the corresponding author upon reasonable request.