
Figures & data
Table 1. The list of primers and probes.
Table 2. ddPCR reaction system.
Figure 1. The specificity detections of the fox primer-probe system.
The specificity of fox primer-probe was tested using the following samples: 1–2 fox, 3–4 beef, 5–6 sheep, 7–8 pork, 9–10 chicken, 11–12 duck, 13 negative.
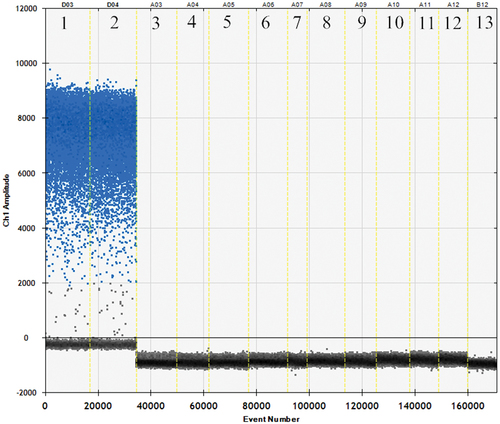
Figure 2. Linear relationship between meat weight and nucleic acid content of fox.
Table 3. The DNA concentration extracted at different sample qualities.
Figure 3. The relationship between the DNA content and the copy number of fox samples.
Figure 4. DNA content gradient map of fox.
Table 4. The copy number measured at different DNA concentrations by ddPCR.
Table 5. Establishment of the fox meat dose response curve.
Figure 5. Map of adulterated fox.
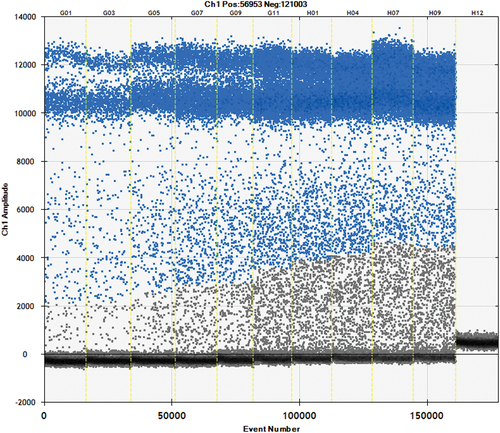
Table 6. Adulteration ratios of mixed samples detected by ddPCR.
Data availability statement
The data supporting the findings of this study are available within the article.