
Figures & data
Figure 1. Varecia variegata, Lemur catta, and Propithecus coquereli represent deep lineages with diverse gut morphologies adapted to different feeding strategies. V. variegata and L. catta are fed similar diets in captivity. Gut diagrams are adapted from.Citation34
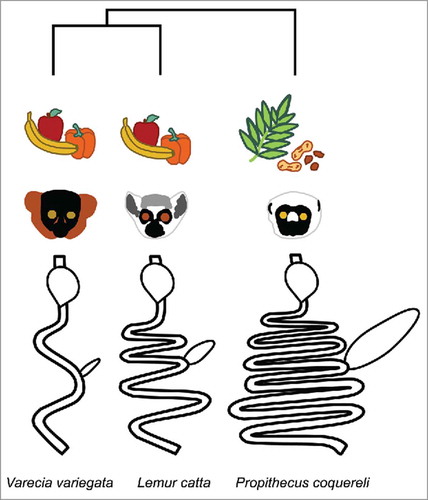
Table 1. Nutritional composition of diets and browse fed to captive Varecia variegata, Lemur catta, and Propithecus coquereli in captivity.
Figure 2. Lemur age and species drive metagenomic variation. We used jackknifed Bray Curtis distances to compare metagenomic profiles at key developmental life stages across three lemur species. Each library was subsampled at a depth of 790000 to match the number of counts in the smallest library. Bray Curtis distance quantifies the dissimilarity between metagenomic libraries based on the abundance of each metabolic pathway represented per metagenome. We also mapped the relationships between samples onto a tree using UPGMA (Unweighted Pair Group Method with Arithmetic mean), based on pairwise distances. Diet and species appear to drive taxonomic variation in panels (a) and (b), while variation in functional potential correlates with age (PC1) and species (PC2) in panel (c). UPGMA further demonstrates that folivorous P. coquereli samples cluster separately from frugivorous L. catta and V. variegata samples at all life stages (d).
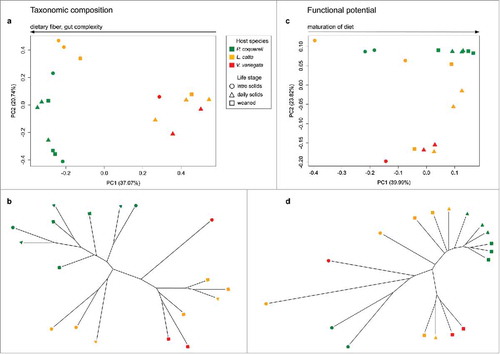
Table 2. Diet differentially impacts metagenomic composition and variation in captive lemurs.
Figure 3. Host diet and species shape gut metagenomic composition. We used t-tests with Bonferroni correction to compare Bray Curtis distance between diets and lemur species. Trends indicate similar overall impacts on both taxonomic composition and functional potential. That is, folivores' gut microbiomes are significantly different from frugivores' (a,b); and distances between different species are significantly greater than variation within the same species (c,d). *indicates p-value < 0.05, **indicates p-value < 0.01, ***indicates p-value < 0.001.
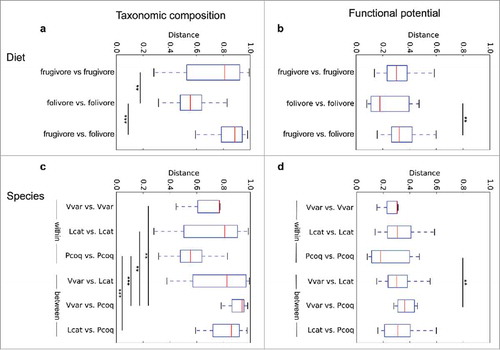
Table 3. LEfSe analysis revealed significant, species-specific taxonomic enrichment (p < 0.05) similar to previous results based on 16S rRNA gene sequencing.Citation 3
Figure 4. Frugivorous and folivorous metagenomes feature differential metabolic enrichment. Metabolic pathways with significant Linear discriminant analysis Effect Size (LEfSe) scores were identified as biomarkers for each diet.
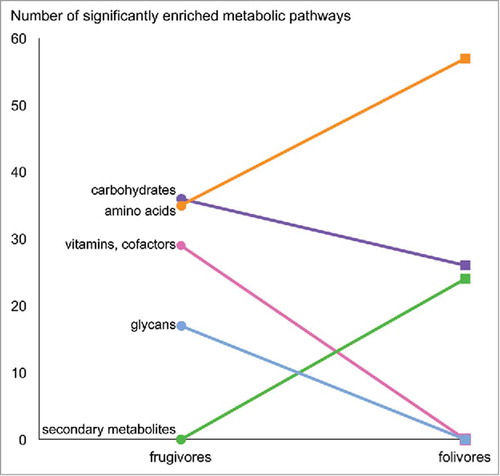
Figure 5. Lemur metagenomes are tailored to diet. We use a “subway diagram” to illustrate the different “metabolic routes” enriched in frugivours versus folivorous metagenomes. L. catta and V. variegata microbiomes are capable of metabolizing a range of sugars, starches, and host-derived glycans, reflecting their fruit-based diet and shorter transit times, while P. coquereli metagenomes appear adapted specifically for anaerobic fiber digestion.
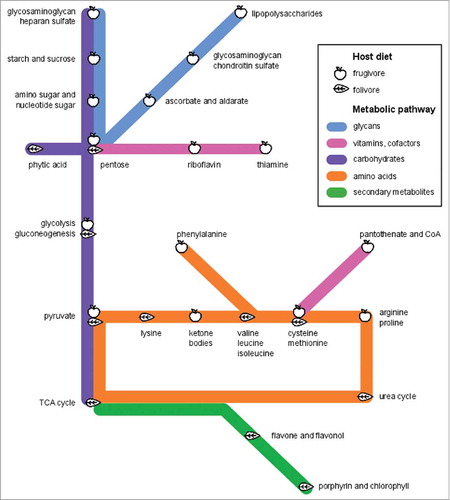
Table 4. Fecal metabolites vary across species. All metabolite concentrations (mmol) were measured and normalized by initial sample weight, then averaged across weaned infants.
Figure 6. Short chain fatty acid (SCFA) production reflects dietary fiber. The measure of each SCFA was normalized by initial sample weight, then calculated as a percentage of total SCFA production and averaged across weaned infants. *indicates p-value < 0.05, **indicates p-value < 0.01.
Figure 7. Gut microbes produce metabolite profiles specific to host diet and species. All metabolite concentrations (mmol) were measured and normalized by initial sample weight, then averaged across weaned infants.
Table 5. Significant microbial metabolites fermented from dietary substrates.
Figure 8. Dietary fiber shapes microbial community form and function. Frugivorous and folivorous diets provide nutritionally distinct substrates for fermentation, and thus cultivate distinct microbiomes (a). For example, folivorous lemurs (in green) consume more dietary fiber (i), which supports a higher diversity of microorganisms (ii) that draw from a more limited, specialized pool of metabolic pathways (iii) to produce more short chain fatty acids (iv) compared to frugivores. We normalized values for each of the four axes on a 0–1 scale. Dietary fiber (%ADF) for each representative diet was normalized on a scale from 0 to 42.5%, which is the highest %ADF value for any single item fed in either diet (tulip poplar; see ). The number of pathways for carbohydrate metabolism associated with each feeding strategy was normalized compared to the abundance of all other metabolic pathways (plotted in ). Having visualized our empirical data, we next demonstrate the utility of microbial geometry for developing hypotheses by predicting the approximate “shape” of an insectivorous lemur (i.e. mouse lemur or aye-aye) GM within the existing contextual framework (b). The chitin that makes up insects' exoskeletons comprises a “fiber” source indigestible to the host, that would provide a substrate for microbial fermentation. However, a previous study demonstrated that chitin-digesting bacteria produce ammonia and reducing sugars rather than SCFAs.Citation26
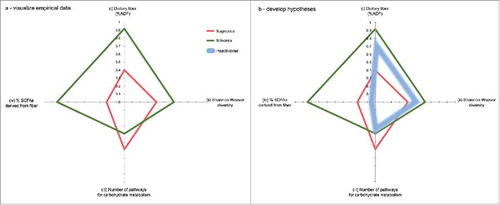
Table 6. Gastrointestinal characteristics and diets fed to captive lemur species.
Table 7. Fecal samples submitted for metagenomic sequencing and NMR spectroscopy. Only a subset of the available samples passed QC requirements for metagenomic sequencing.