Figures & data
Table 1. Socioeconomic characteristics and early life history of children with autism and neurotypical controls.
Table 2. Comparison of BMI and blood biochemical parameters between children with autism and neurotypical controls.
Table 3. Mean intake of nutrients of children with autism and neurotypical controls.
Table 4. Food habits and gastrointestinal symptomatology of children with autism and neurotypical controls.
Table 5. Comparison of serum cytokine concentrations of children with autism and neurotypical controls.
Figure 1. Alpha Diversity comparison of observed OTUs between ASD and control children. Numbers of observed OTUs on the Y axis and multiple rarefied sequences depth on the X axis. Statistical differences using t-test (P<0.001).
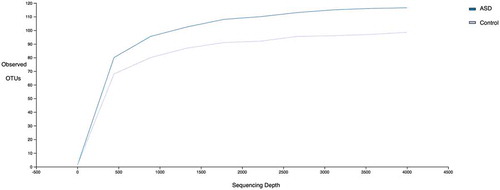
Figure 2. Beta diversity comparison between ASD (red dots) and control children (blue dots) using unweighted UNIFRAC bi-dimensional plot. Statistical differences using MANOVA (P<0.001).
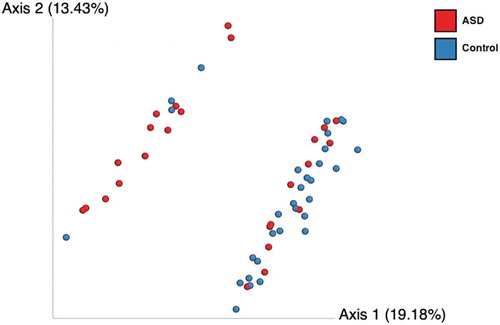
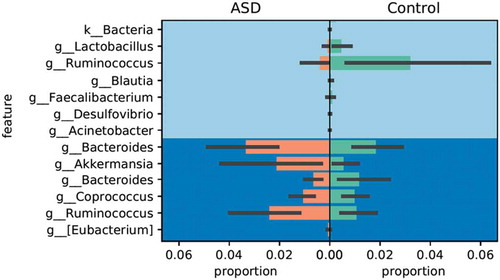
Figure 3. Relative abundance comparison using Gneiss metrics of statistically significant OTUs. Orange bars represent the higher abundant OTUs (including their taxonomic assignation) on the ASD group whilst green bars show the most abundant on the control group. Standard deviation bars are showed.