Figures & data
Figure 1. Crypt atrophy and mild colitis were found in mice with low cellulose diet. (a) Six-week-old female mice were fed a low-cellulose diet (LCD) or high-cellulose diet (HCD) and body weights were monitored for 12 weeks (n = 9/group). (b) Colon lengths of both groups measured after 12 weeks of diet intake (n = 8/group). (c) H&E and PAS staining of colon tissues. Number of crypts per 1-mm length of colon, crypt depth in distal and middle colon, and number of PAS-positive goblet cells per crypt in proximal and distal colon (n = 3/group). (d) IFN-γ- and TNF-α-producing T cells in lamina propria of mouse colons analyzed by FACS (n = 3/group). (e) Heat map of differentially expressed genes in mouse colon tissue by RNA sequencing analysis (n = 3/group). Among 47 significantly changed genes (P < .05, fold change >2.0), those associated with the immunologic and metabolic processes are listed. (f) mRNA expression levels of Mt1 and Mt2 in colon (n = 5/group). (g) Zinc concentrations in freeze-dried cecal contents measured by colorimetric assay (n = 5/group). Data are representative of three independent experiments and shown as mean ± SEM. Statistical analyses were conducted using Student’s t-test or two-way ANOVA with Bonferroni’s post-hoc test. *P < .05; **P < .01.
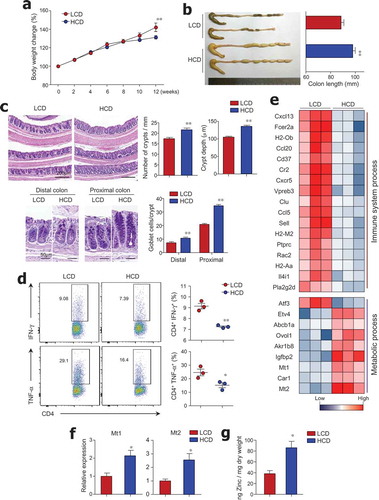
Figure 2. Dietary cellulose protected mice against DSS-induced colitis. (a) Scheme of diet and DSS treatment. Eight-week-old female mice were fed a normal chow diet (NCD) or LCD or HCD for 8 weeks and then DSS (2.5%) for 7 days. (b) Body weight and (c) disease activity index (DAI) scores were measured daily (n = 10/group). (d) Colon length was measured at the end of the experiment (n = 10/group). (e) Representative images of H&E- and PAS-stained sections of whole colon. Bar = 1000 μm and 200 μm. (f) Histologic scores for severity of inflammation, extent of injury, crypt damage, and colonic mucin (n = 5 ~ 8/group). (g) Mucin content in colonic crypts measured in PAS-stained slides (n = 5/group). Data are representative of two independent experiments and shown as mean ± SEM. Statistical analyses were conducted using Student’s t-test and one- or two-way ANOVA with Bonferroni’s post-hoc test. Statistical comparisons between NCD-DSS vs. HCD-DSS are represented as ++P < .01, LCD-DSS vs HCD-DSS as $$P < .01, and NCD-DSS vs. LCD-DSS as #P < .05; ##P < .01; **P < .01.
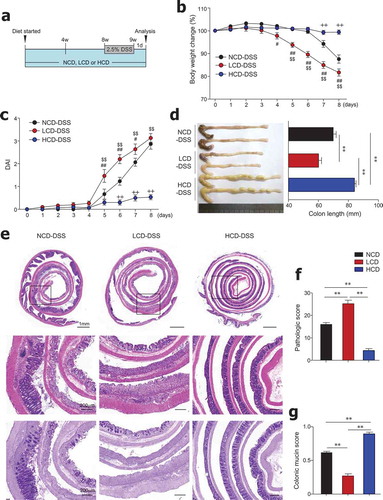
Figure 3. Antibiotic treatment reduced colitis severity in LCD-fed mice and limited protective effects of HCD against colitis. (a) Scheme of diet, antibiotics (ABX) and DSS treatment. Mice (8-week-old females) were fed LCD or HCD plus ABX for 8 weeks and then treated with DSS for 7 days without ABX. (b) Body weight and (c) DAI during DSS treatment were monitored daily (n = 5/group). (d) Colon length measured after sacrifice (n = 5/group). (e) Pathologic scores and (f) representative images of H&E-stained colon sections (n = 5/group). Data are representative of two independent experiments and are mean ± SEM. Statistical analyses were conducted using Student’s t-test and one- or two-way ANOVA with Bonferroni’s post-hoc test. Statistical comparisons between HCD-DSS vs. HCD+ABX-DSS are presented as $P < .05 and $$P < .01. LCD-DSS vs. LCD+ABX-DSS is shown as #P < .05 and ##P < .01. **P < .01.
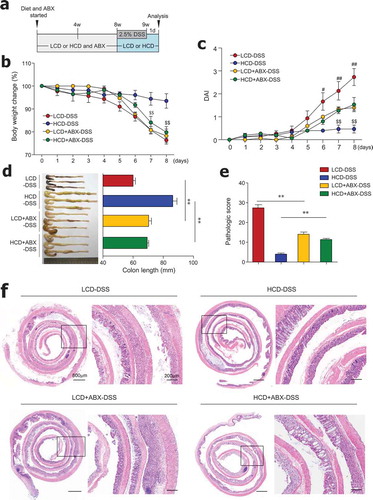
Figure 4. Cellulose consumption changed gut microbiota composition. (a) Relative abundance of operational taxonomic units (OTUs) at genus levels detected by 16s rDNA sequencing in feces of mice fed LCD or HCD for 12 weeks (n = 3/group). (b) Observed OTUs and the Shannon diversity index were assessed. (c) Principal coordinate analysis (PCoA) of weighted UniFrac distances was conducted for fecal microbial communities from mice fed LCD or HCD for 4 weeks (n = 5/group) and 12 weeks (n = 3/group). (d) Cladogram, generated from LEfSe analysis, shows differentially abundant taxa of fecal microbiota (at genus level) that were enriched in LCD- and HCD-fed mice. Dot size is proportional to taxon abundance. Statistical analyses were conducted using Student’s t-test. n.s., not significant (P > .05).
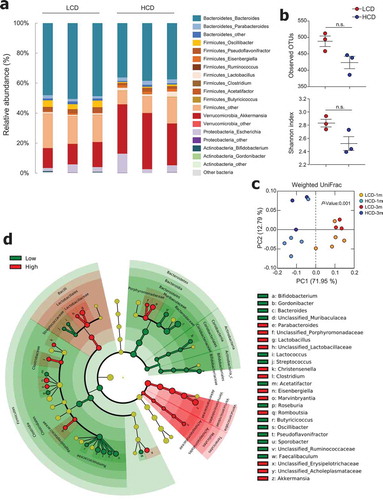
Figure 5. Metabolic profiles were altered by cellulose intake. (a) Levels of SCFA and (b-d) non-targeted metabolomics of cecal contents from LCD- and HCD-fed mice analyzed using LC-MS (n = 5/group). (b) Principal component analysis (PCA) plot showing clustering between groups. (c) Differentially enriched metabolites were selected and clustered in a heatmap. (d) Pathway analysis summary of significant changes in metabolite levels between LCD- and HCD-fed mice (obtained by MetaboAnalyst 4.0) shows pathway impact score from pathway topology analysis on x-axis and negative log (p-values) from pathway enrichment analysis on y-axis. Statistical analyses were conducted using Student’s t-test.
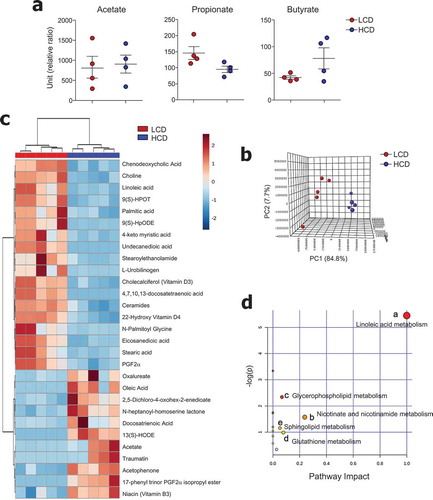
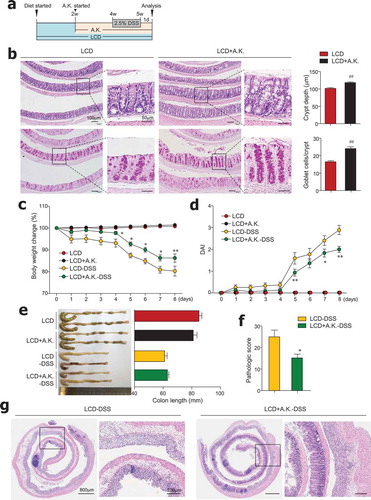
Figure 6. Administration of Akkermansia muciniphila improved gut barrier and ameliorated severe colitis in LCD-fed mice. (a) Experimental design. After 2 weeks of LCD feeding, mice were treated daily with oral gavage of A. muciniphila (A.K.) or PBS for 3 weeks more. DSS treatment was started 2 weeks after A.K. administration began. (b) H&E- and PAS-stained sections of colon and quantification of crypt depth and goblet cells per crypt in distal and middle colon from LCD- and LCD+A.K.-fed mice (n = 3/group). (c) Body weight and (d) DAI scores were recorded daily during DSS treatment (n = 5/group). (e) Colon lengths were measured following sacrifice on day 8 (n = 5/group). (f) Pathologic score and (g) representative H&E-stained images of colon sections (n = 5/group). Data are representative of two independent experiments and are mean ± SEM. Statistical analyses were conducted using Student’s t-test and one- or two-way ANOVA with Bonferroni’s post-hoc test. ##P < .01. Statistical comparisons between LCD-DSS vs. LCD+A.K.-DSS are represented as *P < .05; **P < .01.