Figures & data
Table 1. Characteristics of study participants.
Figure 1. The shift of gut microbiota in typically developing (TD) and ASD children according to the 16S rRNA data.
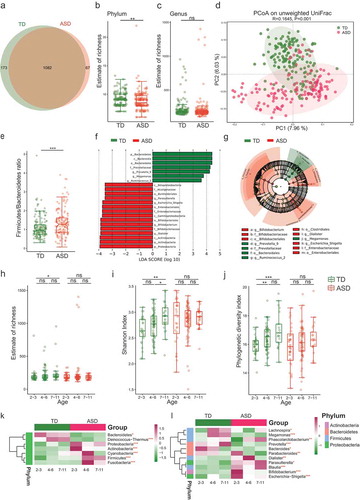
Figure 2. Genera are strikingly different across TD and ASD children.
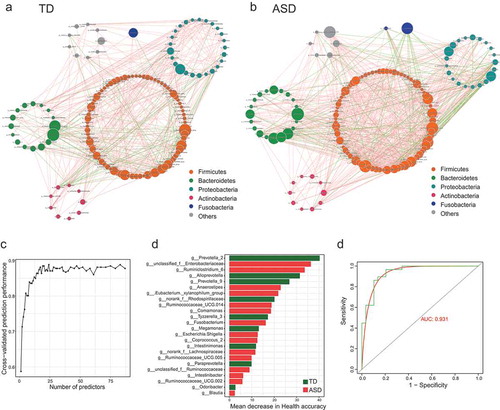
Figure 3. The gut microbiota divergence in ASD with constipation (C-ASD) and TD children based on the metagenomic sequencing data.
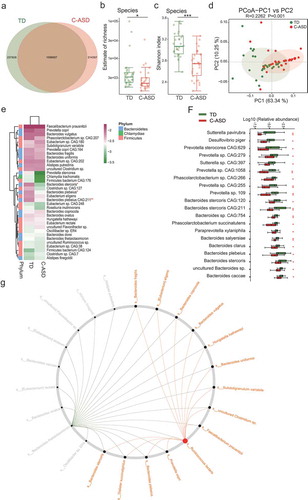
Figure 4. Microbial gene functions annotation on KEGG in ASD with constipation (C-ASD) and TD children.
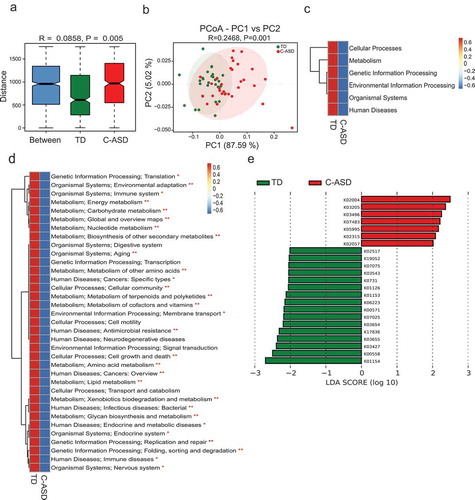
Figure 5. Aberrant metabolic patterns in ASD with constipation (C-ASD) and typically developing (TD) children.
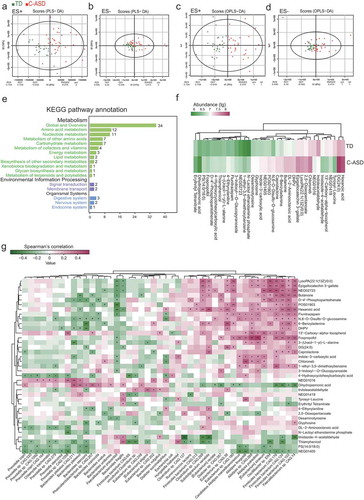
Figure 6. KEGG pathway of the differential metabolites between C-ASD and TD group (Fold change >1.25, VIP ≥ 1, P < .05 T test).
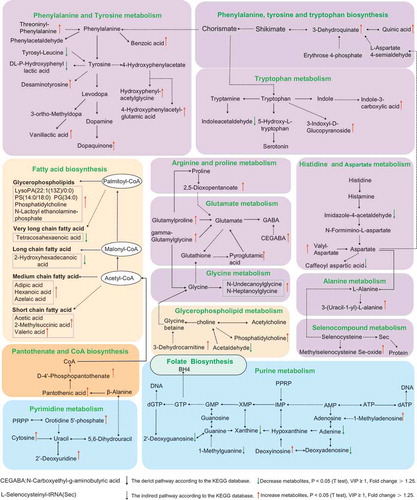
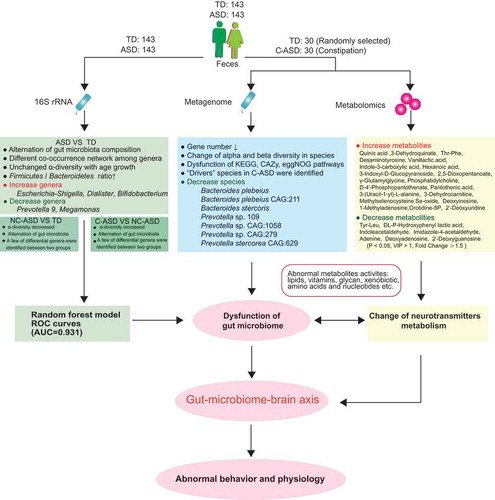
Figure 7. The summary of gut microbiota composition and metabolism analysis between ASD and TD.