Figures & data
Figure 1. Screening berberine and its analogs against the gut microbiome. (a) Structures, chemical names, and abbreviations of berberine and its analogs involved in this study; (b) Analysis of compounds by structural and property similarity. Multidimensional scaling (MDS) was performed using ChemMine, http://chemmine.ucr.edu/; (c) In vitro culturing and metaproteomics-based approach to study microbiome response to berberine analogs.
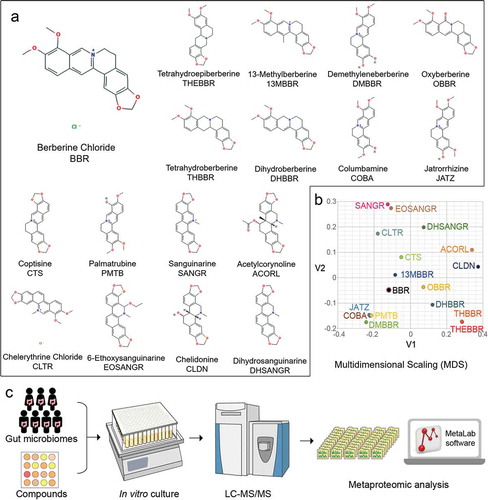
Figure 2. Berberine and its analogs showed marked effects on individual gut microbiomes’ metaproteomic profile. (a) PCA plots of the dataset before and (b) after ComBat transformation. Different colors indicate different individual microbiomes (V20, V22, V24, … are numbers of volunteers). (c) PCA plots of individual compounds based on ComBat-corrected data. Nine of the compounds with better separation are shown; PCA of the other compounds is shown in Supplementary Figure S1. (d) PLS-DA cross-validation results based on individual compounds. (e) Bray–Curtis distance between DMSO control and drug-treated individual gut microbiomes (n = 7). Different letters indicate statistically significant differences at p < .05 level by Tukey’s b test. Box spans interquartile range (25th to 75th percentile), and line within box denotes median.
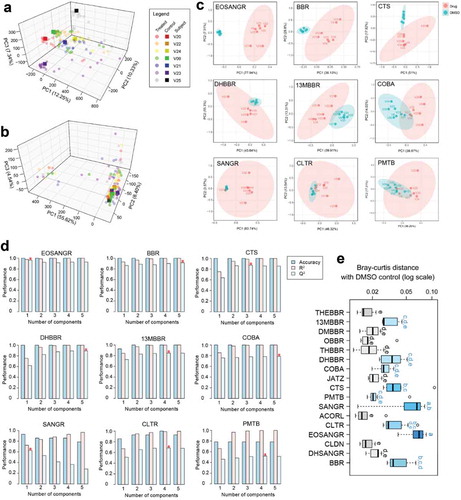
Figure 3. Microbiome functional alterations in response to berberine analogs. (a) Heatmap of COG categories. Sixteen significantly differently abundant COG categories are shown (nonparametric ANOVA, heat colors are based on averages of all tested microbiomes, n = 7). (b) Significantly increased functions found in subgroups of compounds (Mann–Whitney test).
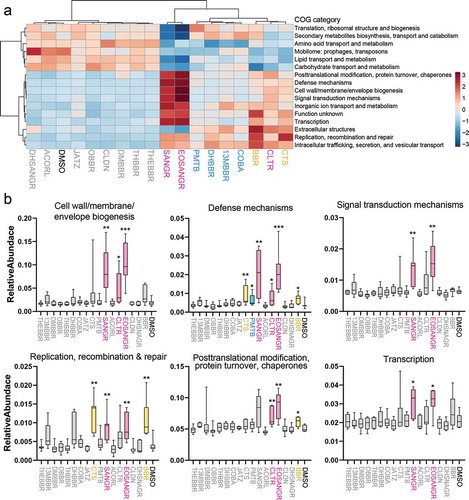
Figure 4. Taxonomic contributors to functional alterations. (a) Heatmap based on VIP scores of protein groups corresponding to these three phyla in each PLS-DA model. (b) Taxonomic enrichment analysis of increased protein groups identified by PLS-DA models. Nonsignificant results (p > .01) were marked with a “×.” (c) Taxon-specific functional enrichment analysis of the increased protein groups in response to 13MBBR, SANGR, and BBR. See also Supplementary Figure 2 for COBA, PMTB, EOSANGR, CLTR, DHBBR, and CTS. (d) Taxonomic enrichment analysis of decreased protein groups identified by PLS-DA models.
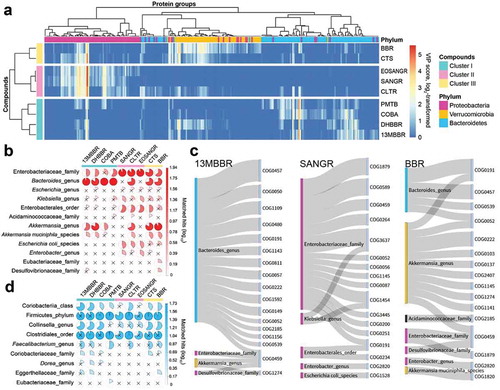
Figure 5. Effect of BBR analogs on bacterial butyrate synthesis pathways and butyrate concentration in the culture. (a) Correlation of enzymes involved in butyrate synthesis pathways. All samples are used to calculate the Pearson’s correlation coefficient r; nonsignificant results (p > .05) were marked with a “×.” (b) Enzymes involved in three butyrate synthesis pathways observed in our dataset. (c) Heatmap showing alteration of enzymes involved in butyrate synthesis by the tested BBR analogs, and mean values from all individual microbiomes are shown (n = 7). (d) Top 30 links between taxon and function among butyrate synthesis-related protein groups in our dataset. (e) Concentration of butyrate, iso-butyrate, and 2-methyl butyrate in an individual’s gut microbiome cultured in the presence of the BBR analogs (mean ± SD, n = 3).
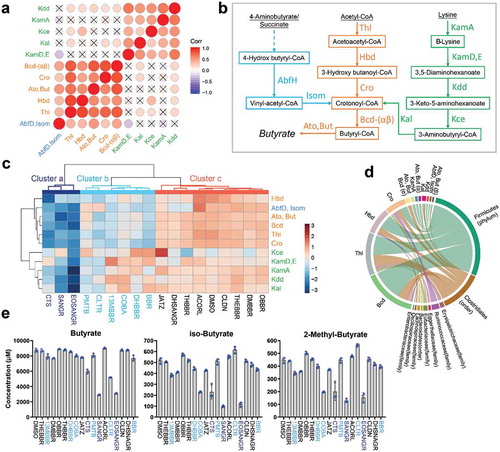
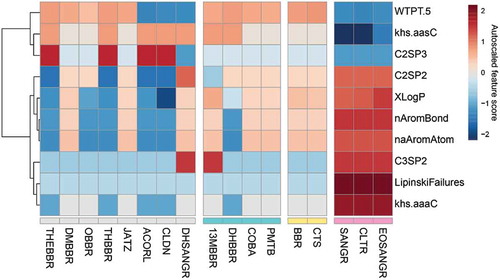
Figure 6. Top 10 different features between clustered compounds.