Figures & data
Figure 1. (a and b): Square root linear-contrast PCA of the fecal microbiome of children and mothers for children’s ages of less than 1 month to 48 months. (a) The biplot shows the weight and direction of fecal bacterial genera and environment vectors in the Bray-Curtis distance matrix. Samples from each group are represented by different colors and symbols. Different patterns inside the symbols represent the different age groups. The numbers of mothers and children are provided in parentheses in the legend. (b) Comparison of relative abundance of nine bacterial genera among more than 1% of total OTUs in fecal samples of children and mothers across the age of less than 1 month to 48 months of children. The bacteria, which were significantly different between fecal samples of children and mothers, are represented as **** p < .0001, *** p ≥ 0.0001 – < 0.001, ** p ≥ 0.001 – < 0.01, * p < .05. BF = fecal samples of children, MF = fecal samples of mothers. A = less than 1 month old (BF = 18, MF = 12), B = 1–<3 months old (BF = 10,MF = 7), C = 3–<6 months old (BF = 23, MF = 13), D = 6–<12 months old (BF = 18, MF = 11), E = 12–<24 months old (BF = 18, MF = 12), F = 24–48 months old (BF = 30, MF = 8).
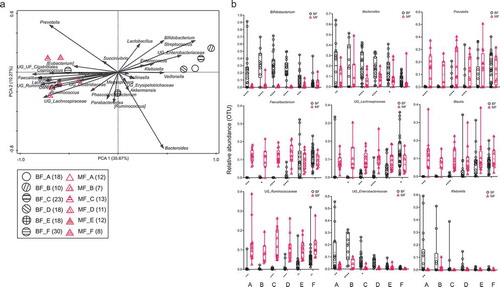
Table 1. Shared OTUs between the mothers’ samples and the fecal samples of the children (%).
Figure 2. (a and b): Square root linear-contrast PCA of fecal samples of children and vaginal swab samples of mothers for children’s ages of less than 1 month to 48 months. (a) The biplot shows the weight and direction of bacterial genera and environment vectors in the Bray-Curtis distance matrix. Samples from each group are represented by different colors and symbols. Different patterns inside the symbols represent the different age groups. The numbers of mothers and children are provided in parentheses in the legend. (b) Comparison of relative abundance of 12 bacterial genera among more than 1% of total OTUs in fecal samples of children and vaginal swab samples of mothers for children’s ages of less than 1 month to 48 months. The bacteria, which were significantly different between fecal samples of children and vaginal swabs of mothers, are represented as **** p < .0001, *** p ≥ 0.0001 – < 0.001, ** p ≥ 0.001 – < 0.01, * p < .05. BF = fecal samples of children, VS = vaginal swab samples of mothers. A = less than 1 month old (BF = 18, VS = 16), B = 1–<3 months old (BF = 10,VS = 7), C = 3–<6 months old (BF = 23, VS = 19), D = 6–<12 months old (BF = 18, VS = 17), E = 12–<24 months old (BF = 18, VS = 12), F = 24–48 months old (BF = 30, VS = 15).
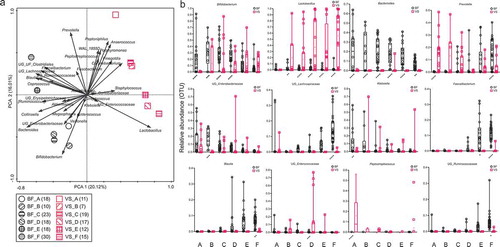
Figure 3. (a and b): Square root linear-contrast PCA of fecal samples of children and breast milk samples of mothers for children’s ages of less than 1 month to 12 months. (a) The biplot shows the weight and direction of bacterial genera and environment vectors in the Bray-Curtis distance matrix. Samples from each group are represented by different colors and symbols. Different patterns inside the symbols represent the different age groups. The numbers of mothers and children are provided in parentheses in the legend. (b) Comparison of relative abundance of nine bacterial genera among more than 1% of total OTUs in fecal samples of children and breast milk samples of mothers for children’s ages of less than 1 month to 12 months. The bacteria, which were significantly different between fecal samples of children and breast milk samples of mothers, are represented as **** p < .0001, *** p ≥ 0.0001 – < 0.001, ** p ≥ 0.001 – < 0.01, * p < .05. BF = fecal samples of children, BM = breast milk samples of mothers. A = less than 1 month old (BF = 18, BM = 15), B = 1–<3 months old (BF = 10, BM = 9), C = 3–<6 months old (BF = 23, BM = 17), D = 6–<12 months old (BF = 18, BM = 4).
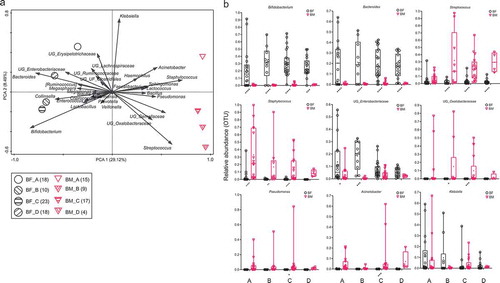
Figure 4. Comparison of concentration of cytokines in fecal water samples of children from the age of less than 1 month to 48 months. The data are expressed as the mean concentration in pg/ml. The number of samples is provided in parentheses at the X-axis. A = less than 1 month old, B = 1–<3 months old, C = 3–<6 months old, D = 6–<12 months old, E = 12–<24 months old and F = 24–48 months old.
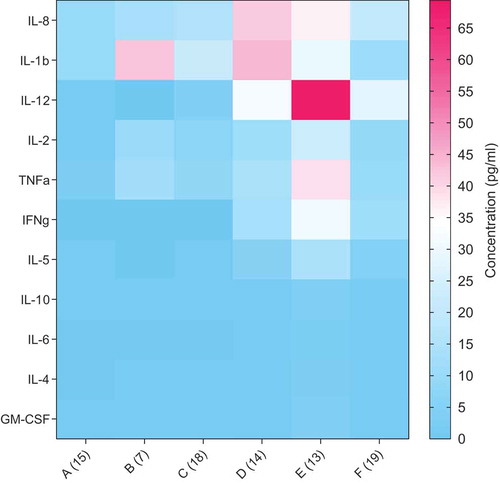
Figure 5. Correlation of known pathogens (X-axis) and known commensal gut species (Y-axis) at the species level of abundances (a) before and (b) after weaning (6–<12 months old) in the fecal samples of children. Spearman correlation coefficient values are plotted and presented as a heatmap. Positive and negative correlations are represented by different colors according to the gradient scales of the correlation coefficient. The significantly different correlations are represented as **** p < .0001, *** p ≥ 0.0001 – < 0.001, ** p ≥ 0.001 – < 0.01, * p < .05.
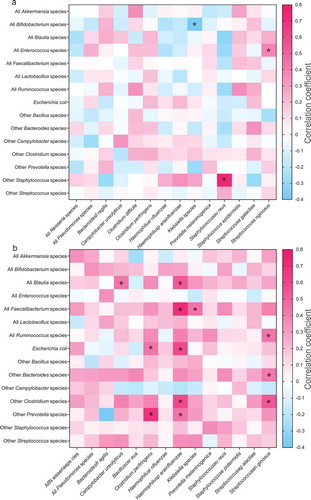
Figure 6. Comparison of concentration of free bile acids – (a) primary bile acids (CDCA, CA) (b) secondary bile acids (DCA, LCA, UDCA) (c) 12 bile acids – in fecal water samples of children from the age of less than 1 month to 48 months. The mean and standard error of the mean (SEM) are presented. Numbers of samples are described in parentheses at the X-axis. A = less than 1 month old, B = 1–<3 months old, C = 3–<6 months old, D = 6–<12 months old, E = 12–<24 months old, F = 24–48 months old age. CDCA = chenodeoxycholic acid, CA = colic acid, UDCA = ursodeoxycholic acid, DCA = deoxycholic acid, LCA = lithocholic acid, GCDCA = glycochenodeoxycholic acid, TCDCA = taurochenodeoxycholic acid, TCA = taurocholic acid, GCA = glycocholic acid, GDCA = glycodeoxycholic acid, GLCA = glycolithocholic acid, HDCA = hyodeoxycholic acid, TUDCA = tauroursodeoxycholic acid, GUDCA = glycoursodeoxycholic acid, TDCA = taurodeoxycholic acid, TMCA (a + b) = alpha- and beta-tauromuricholic acid, TLCA = taurolithocholic acid.
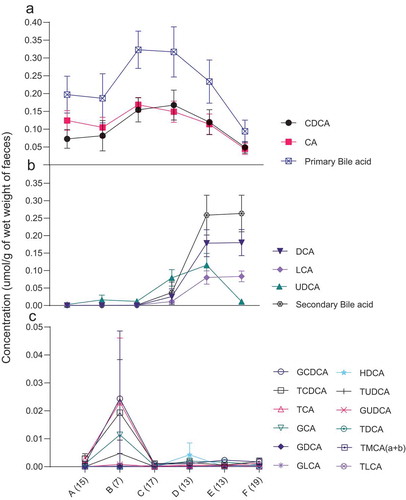
Table 2. Correlation between fecal bacterial genus abundance (> 1% of total OTUs) and amount of certain food groups children consumed per day at ages (a) 6–12 months, (b) 12–24 months and (c) 24–48 months.
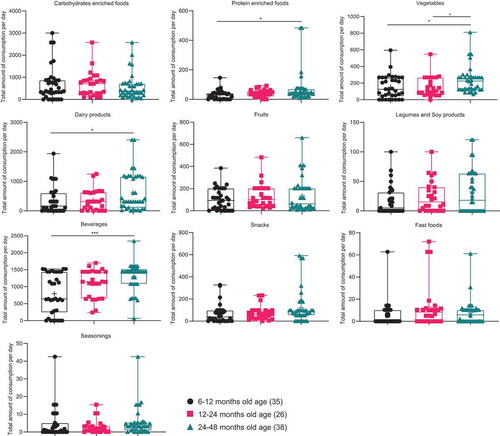
Figure 7. Comparison of the total amount of dietary consumption (g) per day of children aged 6–48 months. The foods, which were significantly different between three age groups of children, are represented as **** p < .0001, *** p ≥ 0.0001 – < 0.001, ** p ≥ 0.001 – < 0.01, * p < .05.