Figures & data
Figure 1. Bifidobacterium longum (B.longum) colonized the ileum terminal epithelium and alleviated visceral sensitivity in water avoidance stress (WAS) rats. The WAS model was produced by placing rats on a block (10 × 8 × 8 cm) in the middle of a plastic tank at 8:00–9:00 o’clock every morning for 10 days. The B. longum group was administered 1 × 10⁹ CFU B. longum for 10 days, whereas rats in the control group were given normal saline. (a) Scanning electron microscopy indicated that B. longum could colonize the mucosa of the terminal ileum after oral administration. Scale bar = 200 μm. (b, c) Fecal pellet output (FPO) and the proportions of unformed stool were calculated among the three groups. (d, e) The threshold intensity of colorectal distention (CRD) and abdominal withdrawal reflex (AWR) score were evaluated among the three groups (n = 8). The threshold value in the WAS group was significantly decreased, and B. longum significantly increased the threshold. For the AWR, the WAS group showed an increased score at 40 and 60 mmHg pressure, and B. longum administration effectively decreased the AWR under both pressures. However, there was no significant difference in scores among the three groups at 20 and 80 mmHg pressure. (f) Body weight was recorded among the three groups on days 1 and 10. On day 1, the body weight among the three groups did not differ, whereas on day10, the weight of WAS group rats was much lower than that of control group rats; B. longum administration improved the body weight in the B. longum group. The data are shown as the mean ± SD, *, p < .05, **, p < .01, **, p < .001 WAS vs Ctrl and #, p < .05 B. longum vs WAS, n = 8.
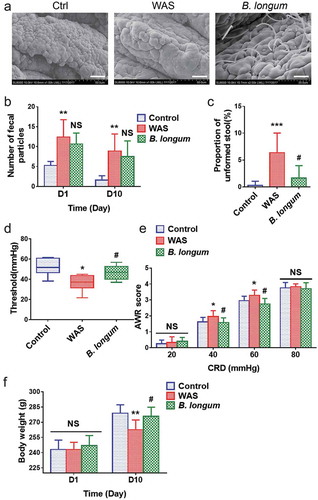
Figure 2. Alterations in the composition and diversity of the intestinal microbiota in water avoidance stress (WAS) rats following B. longum administration. (a) The rarefaction curve at the operational taxonomic unit (OTU) level showed a plateau and saturation phase, indicating that the sample size was sufficient to capture the overall microbiota structure. (b, c) The Sobs index (b) and phylogenetic diversity (PD) index (c) of the three groups at the OTU level. (d, e) β-Diversity was calculated by principal co-ordinate analysis (PCoA) (d) and analysis of similarities (ANOSIM) (e) at the OTU level based on weighted unifrac analysis, indicating the different fecal microbiota structure among the three groups (weighted unifrac, ANOSIM r = 0.5992, p = .001). (f, g) Relative abundance of the gut microbiota at the phylum level (f) and the top 4 of them with significant differences (g) among the three groups. (h, i) Relative abundance of microbiota at the genus level (h) and the top 4 microbiota of them with significant differences among the three groups (i). Data are shown as the mean ± SD, *, p < .05, **, p < .01, **, p < .001 WAS vs Ctrl and #, p < .05 B. longum vs WAS, n = 8.
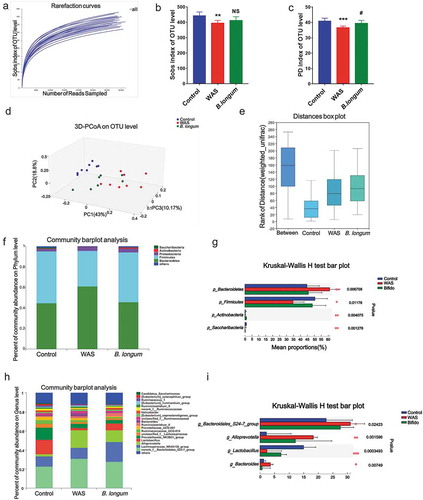
Figure 3. Bifidobacterium longum (B.longum) enhanced lysozyme expression in Paneth cells. (a) Representative images of ileal sections of rats from health control group (Ctrl), water avoidance stress (WAS) treatment group (WAS), and group subjected to WAS treatment followed by administration of B. longum for 10 days (B. longum). Cell nuclei in the sections were stained using DAPI (blue) and lysozyme was stained with an anti-lysozyme antibody (red). The intensity of the cell nucleus and lysozyme was quantified with Image J software. Scale bar = 100 μm. (b) Expression of lysozyme in the rat ileum was determined by quantifying the relative intensity of lysozyme/DAPI fluorescence from an average of 5 sections per rat of 5 rats from each group using blind examination by independent readers. Data are shown as the mean ± SD, **, p = .0014 of Ctrl vs WAS, ##, p = .0052 of B. longum vs WAS. (c) Analysis of the number of Paneth cells per crypt from an average of 5 well-preserved crypts per slide and of 5 rats from each group. Data are shown as the mean ± SD, p = .3191 of Ctrl vs WAS, #, p = .4405 of B. longum vs WAS. (d) Relative expression of lysozyme mRNA of ileal tissue from Ctrl, WAS, and B. longum rats were quantified by QPCR. Data are shown as the mean ± SD, ***, p < .0001 of Ctrl vs WAS, ###, p = .0005 of B. longum vs WAS, n = 3. (E, F.) Western blot analysis of lysozyme protein expression in ileal tissue of 3 representative individual rats from each group. Data are shown as the mean ± SD, ***, p = .0002 of Ctrl vs WAS, #, p = .0190 of B. longum vs WAS, n = 3.(g–j) Correlation of antibacterial peptide Lysozyme mRNA expression with intestinal microbiome g _ Bacteroidales _ S24-7-group (g), g _ Alloprevotella (h), g _ Bacteroides (i), and g _ Lactobacillus (j). Data are shown as the mean ± SD.
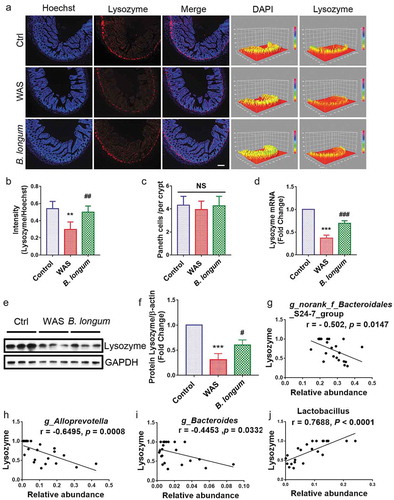
Figure 4. Bifidobacterium longum (B.longum) restored intestinal epithelial cell proliferation and enhanced mucosal repair in water avoidance stress (WAS) rats. (a) H&E staining of representative ileal sections of the rats from the three groups. The dashed line indicates the position of intestinal crypt. Scale bar = 100 μm. (b–d) Morphometric quantification of the intestinal crypt depth (b), villus height (c), and crypt/villus ratio (d) from five well-preserved crypts per slide of 8 rats from each group. Data are shown as the mean ± SD, (B) *, p = .0173 of Ctrl vs WAS, ##, p = .0014 of B. longum vs WAS (C).**, p = .0096 of Ctrl vs WAS, #, p = .0436 of B. longum vs WAS. (D) p = .9710 of Ctrl vs WAS, p = .2626 of B. longum vs WAS. (e) Intestinal permeability assay to detect intestinal permeability by measuring the concentration of FITC-D4000 in the rat serum from the three groups (n = 4 per group). Data are shown as the mean ± SD, ***, p = .0001 of Ctrl vs WAS, ##, p = .0018 of B. longum vs WAS. (f–h) Western blot analysis of occludin and LGR5 protein expression in the ileal tissue of 3 representative individual rats from each group. Quantification of GAPDH-normalized band intensity by Image-Pro Plus; data are shown as the mean ± SD, (g) **, p = .0023 of Ctrl vs WAS, ##, p = .0037 of B. longum vs WAS, n = 3, (h) **, p = .0022 of Ctrl vs WAS, ##, p = .0014 of B. longum vs WAS, (k) **, p = .0019 of Ctrl vs WAS, ##, p = .0271 of B. longum vs WAS, n = 3. (i) QPCR analysis of Lgr5 mRNA expression dissected from ileal tissues of the three groups. Data are shown as the mean ± SD, ***, p = .0007 of Ctrl vs WAS, ##, p = .0095 of B. longum vs WAS, n = 3. (j) Representative images of intestinal epithelial cells of ileal sections of rats from the three groups with PCNA (red) staining. The intensity of the cell nucleus and PCNA was quantified by Image J software. Scale bar = 100 μm. Results in (J) are shown as the average values of 5 sections per rat of 5 rats from each group. Data are shown as the mean ± SD, *, p = .0019 of Ctrl vs WAS, #, p = .0271 of B. longum vs WAS.
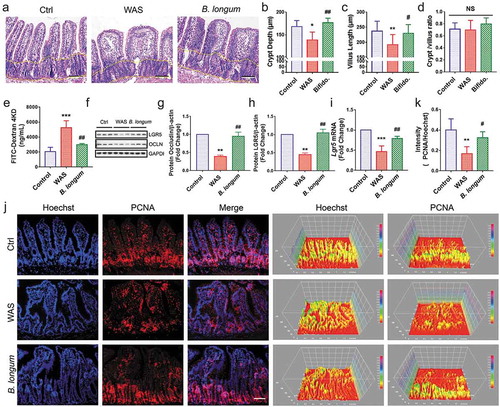
Figure 5. Bifidobacterium longum (B.longum) promoted the proliferative activity of enteroids. (a) Transmission electron photomicrographs showed normal morphology and sizes of cell nucleus, endoplasmic reticulum, Golgi, tight junction, mitochondria, and microvilli of enteroids in B. longum group compared to in the control group. The large granules in the Paneth cells were secretory granules containing lysozyme. N, cell nucleus; ER, endoplasmic reticulum; TJ, tight junction; M, mitochondria; P, Paneth cells; AS, apical surfaces; BS, basolateral surfaces; L, lumen. Scale bar = 10 μm. (b–e) Western blot analysis of proteins expression of LGR5 (c), PCNA (d), and lysozyme (e) of enteroids after incubating with B. longum. Data are shown as the mean ± SD, (C) *, p = .029, (D) ***, p = .0001, (E) ***, p < .0001, n = 3. (f) EdU proliferation analysis of enteroids after incubation with B. longum. Dot plot of EdU-647 staining (Y-axis, 647) vs FSC. The percentage of gated cells (EdU-positive) is highlighted. (g) Representative images of fluorescence staining of E-cadherin (E, green), PCNA (red), and Hoechst (H, blue) staining of enteroids after incubating with B. longum. Scale bar = 50 µm (left) or 10 µm (right).
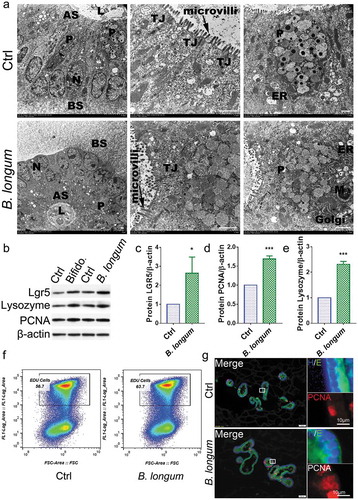
Figure 6. Alterations related to Paneth cells functions after incubating with Bifidobacterium longum (B. longum). (a) Venn diagram showing common and uncommon gene expression in enteroids between control and B. longum group by microarray analysis. There were 526 and 359 genes independently expressed in the Ctrl and B. longum groups, respectively, and 11,707 genes expressed in both groups. (b) The heat map of microarray expression experiments illustrates the expression differences in some proliferation-related mRNAs on the microarray between B. longum group and Control group. (c) KEGG pathway analysis indicated activation of the cell cycle, Wnt signaling, TGF-β signaling, and ErrB signaling pathways in the B. longum group. (d, e) Fold-change (FC) in genes encoding components of Egf signaling and Wnt signaling in microarray expression experiments. (f) Fluorescence-activated cell sorting (FACS) analysis of CD24-positive cells showing the proportion of Paneth cells in enteroids of the two groups (Ctrl and B. longum). Two CD24 high populations differed by side-scatter (SSC) pattern, and CD24hiSSClow cells were enteroendocrine cells, whereas CD24hiSSChi cells were Paneth cells according to previous reports. (g, h) QPCR analysis of mRNA expression of Wnt3a (g) and Tgf-β (h) in Paneth cells sorted from (F). Data are shown as the mean ± SD, (G) ***, p < .0001, (H) *, p = .0233, n = 3. (i, j) QPCR analysis of mRNA expression of Wnt3A (G) and TGF-β (H) in ileal tissue of rats from the healthy control group (Ctrl), water avoidance stress (WAS) group, and group subjected to WAS followed by administration of B. longum for 10 days (B. longum). Data are shown as the mean ± SD, (i) p = .5172 of Ctrl vs WAS, #, p = .0190 of B. longum vs WAS. (j) p = .4647 of Ctrl vs WAS, ##, p = .0022 of B. longum vs WAS.
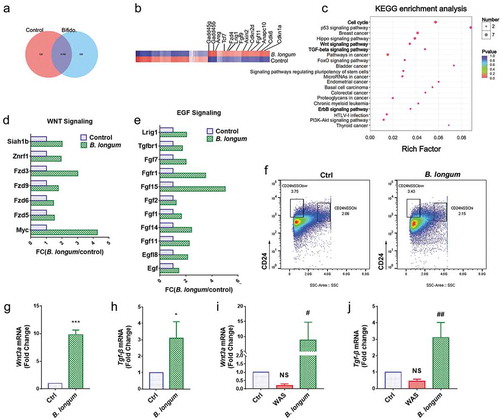
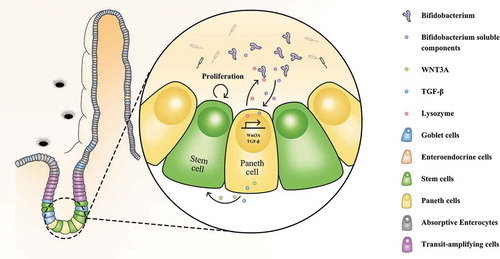
Figure 7. Novel mechanism underlying the beneficial effects of Bifidobacterium longum (B. longum) for treatment of IBS. B. longum promoted the expression of lysozyme, WNT3A, and TGF-β in Paneth cells, and accordingly ameliorated microbiota dysbiosis and promoted intestinal stem cell proliferation.