Figures & data
Figure 1. Neutrophil activation, histopathology and fecal shedding in Camp+/+ and Camp−/- mice infected by Citrobacter rodentium. C57BL/6 Camp+/+ and Camp−/- mice were orally infected with C. rodentium (1 x 10⁸ CFU in 200 μL of PBS) for 7 d. (a) Immunofluorescence neutrophil staining of murine colons with anti-Ly6 G antibody (5 μg/mL). Neutrophils were widely distributed in colon (lumen, crypt and lamina propria) although this representative image only shows neutrophils along crypts (yellow arrows) and in lamina propria (white arrows). Fluorescence was calculated using ImageJ 1.50i software and represented mean fluorescence intensity (MFI). (b) MPO activity in murine colonic mucosa after 7 d pi with C. rodentium. Data are represented as absolute values (MPO activity (U/g)) with respect to Camp+/+ PBS control. (c) H&E microphotography of murine colons. Black arrows denote crypt length. (d-f) Histograms representing absolute values of lipocalin-2 (ng/mL) secretions in feces (d), crypt length (e) and colon length (f) in control and infected mice. (g) For C. rodentium burden, fresh fecal pellets (1/per mouse) were collected at 3, 5 and 7 d pi (n = 4 mice/group) and serially diluted in sterile PBS, plated on McConkey agar and counted to obtain bacterial CFU/g. Data were normalized to infected Camp+/+ mice and represented as fold change in CFU/g of feces. One fold change represents ~105, 106 and 107 CFU/g for 3, 5 and 7 d pi, respectively. Data are shown as means ± SEM (n = 4 mice/group). P < .05 (one-way ANOVA post hoc Bonferroni correction for multiple group comparison or two-tailed Student’s t-test for two groups) was considered significant.
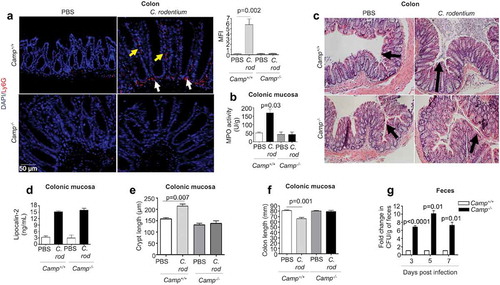
Figure 2. Determination of chemokine production in colonic mucosa and primary colonic epithelial cells in Camp+/+ and Camp−/- mice challenged by Citrobacter rodentium. Camp+/+ and Camp−/- mice were infected with C. rodentium (1 x 10⁸ CFU in 200 μL of PBS) for 7 d. (a) CXCL1 secretions in distal colonic mucosa of infected Camp+/+ and Camp−/- mice (ELISA). Chemokine production of CXCL1 (b), CCL3 (c) CXCL9 (d), CXCL10 (e), CCL5 (f) and CXCL2 (g) in isolated primary CD326+CD45− colonic epithelial cells (multiplex bead-based assay). Data are shown as mean ± SEM (n= 3–6/group). P < .05 (one-way ANOVA post hoc Bonferroni correction for multiple group comparisons or two-tailed Student’s t-test for two groups) was considered significant.
Figure 3. CXCL1/CXCL8 synthesis in colonic epithelium stimulated with cathelicidins and LPS or Salmonella typhimurium infection. (a-b) CXCL8 were determined by ELISA in cell supernatants from human colonic HT29 epithelial cells (a) and human colonic T84 epithelial cells (b). Challenge consisted of LL-37 (10 μg/mL) and LPS (1 μg/mL), either alone or in combination for 4 h. (c-d) CXCL1 protein expression determined by ELISAs in homogenized colons of Camp−/- mice (n = 3–5 mice/per group) (c) and colonoids from Camp+/+ mice (d) treated with LPS (1 μg/g or 1 μg/mL), LL-37 (1 μg/g or 10 μg/mL) or scrambled-sequence peptide sLL-37 (10 μg/mL; only in mouse colonoids), either alone or in combination (intraperitoneally for 3 h in (C) and ex vivo for 4 h in (D)). (e-f) HT29 cells either transfected with sham plasmid/knocked-down for LL-37 (ShLL-37) or untransfected were challenged with S. typhimurium (MoI 10:1; 2 × 10⁷ CFU) for variable time points (up to 8 h). Bar graphs are representing LL-37 secretions (1 fold ~250 pg/mL) (e) and CXCL8 secretions (f) in cell supernatants. Graphs are representative of three independent experiments. Data are shown as mean ± SEM (n = 3 independent experiments done in triplicate, unless mentioned otherwise). P < .05 (one-way ANOVA post hoc Bonferroni correction for multiple group comparison or two-tailed Student’s t-test for two groups) was considered significant. ND = “not detected”.
Figure 4. TLR4 dependent CXCL8 synthesis in colonic epithelial cells stimulated with cathelicidins and LPS. (a-d) HT29 cells used were either normal (A-B and D) or sham transfected/knocked-down in TLR4 (c). (a-c) Cells were pre-treated with LPS-RS (5 μg/mL) (or not; in C) followed by LPS (1 μg/mL) and LL-37 (10 μg/mL) alone or in combination. (d) Cells were treated by a mix of either LPS (1 μg/mL) or LL-37 (10 μg/mL) (1 h, 37°C) followed by substitution with polymyxin B (Poly B; 10 μg/mL) or LPS (1 μg/mL)+polymyxin B (Poly B; 10 μg/mL)/bovine serum albumin (BSA; 10 μg/mL) (1 h, 37°C) followed by LL-37 (10 μg/mL). Polymyxin B alone and BSA were used as negative controls. (a) CXCL8 mRNA levels were assessed by qPCR. GAPDH was used as housekeeping control. (b-d) CXCL8 secretion was quantified by ELISA after 4 h. Data are shown as means ± SEM (n = 3 independent experiments done in triplicate). P < .05 (one-way ANOVA post hoc Bonferroni correction for multiple group comparison or two-tailed Student’s t-test for two groups) was considered significant.
Figure 5. LL-37-mediated GM1-lipid raft dependent LPS uptake regulates CXCL8 synthesis via intracellular TLR4 signaling in colonic epithelial cells. (a) Fluorescent images depicting TLR4 localization in non-permeabilized HT29 cells after LPS (1 μg/mL) ± LL-37 (10 μg/mL) for 4 h (anti-TLR4 antibody; yellow). A bar graph representing quantification of TLR4 fluorescence as mean fluorescence intensity (MFI). (b-c) HT29 cells were challenged with a combination of Alexa488-conjugated-LPS (1 μg/mL) and LL-37 (10 μg/mL) for variable intervals (up to 4 h) followed by quantification of fluorescence (b) or combined with wheat germ agglutinin (WGA) as a membrane marker (for 4 h) (c). (d) CXCL8 was quantified by ELISA in supernatants from HT29 cells treated with LPS and LL-37 ± exogenous monosialotetrahexosylganglioside (GM1; 100 μg/mL). GM3 (100 μg/mL) was used as a negative control. (e-f) HT29 cells were pre-treated with a mix of lipid raft inhibitors (MM: methyl-β-cyclodextrin (500 μM) and mevinolin (250 ng/mL)), or endocytosis inhibitors cytochalasin D (CytoD; 2 μM), or dynamin-dependent endocytosis inhibitor (D15; 10 μM; only for (e)) for 1 h, followed by stimulation with nonconjugated LPS (1 μg/mL) (E) or Alexa488-conjugated-LPS (1 μg/mL) (f) and LL-37 (10 μg/mL), either alone or in combination for 4 h. (E) CXCL8 protein secretion was quantified using ELISA. (b and f) LPS uptake was assessed using immunocytochemistry and quantified using ImageJ 1.50i software. Fluorescence was calculated and presented as mean fluorescence intensity (MFI) for three independent experiments. Data are shown as means ± SEM (n = 3 independent experiments, done in triplicate). P < .05 (one-way ANOVA post hoc Bonferroni correction for multiple group comparisons or two-tailed Student’s t test for two groups) were considered statistically significant.
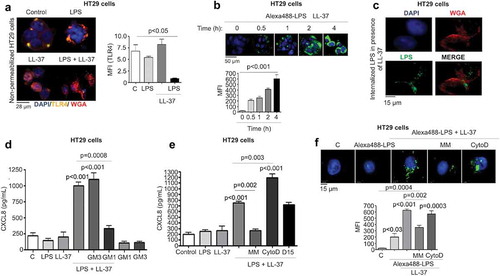
Figure 6. Src-EGFR kinase-mediated p38MAPK signaling promotes CXCL8 synthesis in colonic epithelial cells stimulated by cathelicidins and LPS. (a) Activation of p38MAPK in HT29 cells stimulated by LPS+LL-37 was detected by western blotting with antibodies against phosphorylated p38MAPK. Total loading was confirmed after immunoblotting with p38MAPK. (b-g) HT29 cells were pre-treated with SB203580 (10 μM) (b-c), AG1478 (1 μM) (d-f), the Src kinases inhibitor PP1 (1 μM) (D-E and G) or LPS-RS (5 μg/mL) (e) for 1 h, followed by LPS (1 μg/mL) and LL-37 (10 μg/mL) treatment. CXCL8 mRNA synthesis was quantified by qPCR after 2 h (n = 4) (b) or CXCL8 protein secretion (n = 4) by ELISA after 4 h (c). (d) Activation of EGFR was assessed after 2 h using western blotting for phosphorylated EGFR. Normalization was done with total EGFR. (E) Activation of p38MAPK was assessed after 2 h using western blotting for phosphorylated p38MAPK. p38MAPK was blotted as housekeeping control. (f-g) Total CXCL8 secretions were quantified using ELISA. Data are shown as means ± SEM (n = 3 independent experiments done in triplicate, unless mentioned otherwise in respective sub-figure). P < .05 (two-tailed Student’s t-test for two groups) was considered significant.
Figure 7. MEK1/2 kinase-dependent NF-κB activation is required for CXCL8 synthesis induced by cathelicidins and LPS in colonic epithelial cells. (a-b) HT29 cells were pre-treated with the NF-κB inhibitor PS1145 (1 μM; 1 h) followed by LPS (1 μg/mL) and LL-37 (10 μg/mL). CXCL8 gene synthesis was quantified by qPCR after 2 h (n = 4) (a) and protein secretion by ELISA after 4 h (b). (c) HT29 cells were transfected with 174 bp wild type (FL) or mutant CXCL8 promoter construct (containing individual mutated sites for either NF-κB or AP-1 or NF-IL-6) upstream of the luciferase gene, followed by stimulation with LPS (1 μg/mL) and LL-37 (10 μg/mL) for 4 h. Data are represented as fold change in relative light units (RLU), normalized to renilla luciferase transfection control. IL-1β (10 ng/mL) was used as positive control. (d-e) HT29 cells sham transfected/knocked down for TLR4 (ShTLR4) (d) or treated with inhibitors for Src kinases (PP1; 1 μM), EGFR kinase (AG1478; 1 μM) and p38MAPK (SB203580; 2 μM) for 1 h (e) were stimulated by LPS+LL-37, either alone or in combination for 2 h. p65 phosphorylation was assessed by western blotting with specific antibodies. (f-g) HT29 cells normal and/or inhibited for ERK1/2 (PD98059; 20 μM) (only (g)) were stimulated by LPS+LL-37, either alone or in combination for 2 h. ERK1/2 (f) or p65 phosphorylation (G) was assessed by western blotting with specific antibodies. Total loading was confirmed after blotting for GAPDH. Data are shown as means ± SEM (n = 3 independent experiments done in triplicate). P < .05 (one-way ANOVA post hoc Bonferroni correction for multiple group comparison or two-tailed Student’s t-test for two groups) were considered significant.
Figure 8. Secreted CXCL8 from colonic epithelium stimulated by cathelicidins and LPS induces calcium flux and activation of neutrophils. (a-b) Human neutrophils (1 x 10⁴/well in an 8-well chamber) were incubated at 37° C for 1 h alone (a) or pre-incubated with Fluo4-NW dye (1 x 10⁶ cells, 45 m, RT) (b). Neutrophils were exposed to supernatants from HT29 cells unstimulated (control) or stimulated with LPS (1 μg/mL) and LL-37 (10 μg/mL), either alone or in combination, for 4 h ± anti-CXCL8 antibody (1 μg/mL) or CXCR1/2 inhibitor SCH527123 (20 μM). rCXCL8 was used as positive control. IgG was used as an isotype control. (A) Neutrophil activation was assessed by neutrophil elastase secretion (depicted by white arrows) using immunocytochemistry with anti-neutrophil elastase antibody (5 μg/mL). Data are represented as fold increase in MFI normalized to respective control, for three independent experiments. (B) Data are represented as percentage fluorescence emission at 530 nm of positive control calcium ionophore A23187 (CI A23187). Data are shown as means ± SEM (n = 3 independent experiments done in triplicate). P < .05 (one-way ANOVA post hoc Bonferroni correction for multiple group comparison or two-tailed Student’s t-test for two groups) was considered significant.
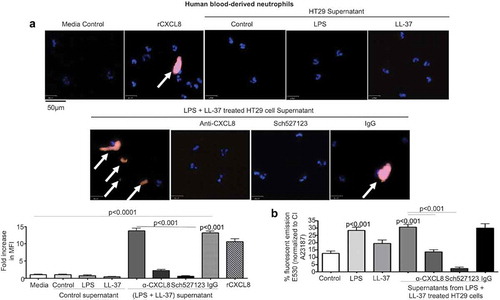
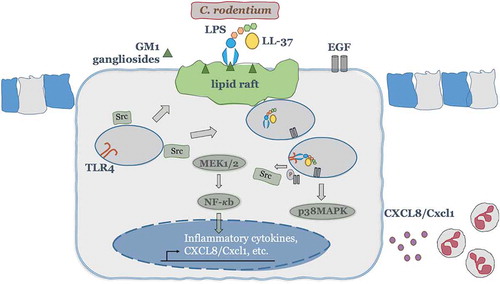
Figure 9. A theoretical scheme of signaling mechanisms elicited by cathelicidins in synergy with LPS to promote CXCL8 secretion in colonic epithelium and subsequent neutrophil recruitment/activation. In colonic epithelial cells, LL-37 physically binds and facilitates LPS uptake via interaction with GM1 (monosialotetrahexosylganglioside) in lipid rafts, where EGFR and Src kinases reside. Intracellularly, LPS interacts with TLR4 to promote activation of two signaling axes: one p38MAPK dependent, which relies on Src and EGFR kinases cross-talk and subsequent p38MAPK activation; second NF-κB dependent, which signals via MEK1/2 but independent of Src, EGFR and p38MAP kinases. Both signaling pathways together promote colonic CXCL8 protein synthesis and secretion. The induced colonic CXCL8 chemokine regulates intestinal defenses via neutrophil recruitment/activation.