Figures & data
Figure 1. Tumor development with AOM/DSS in mice and recovery of the AOM/DSS-induced colitis-associated colorectal cancer (CAC) mouse model with L. gasseri 505 (LG), C. tricuspidata leaf extract (CT), and fermented CT by L. gasseri 505 (FCT). (a) Experimental procedure for development of the AOM/DSS-induced CAC model and sample (LG, CT, or FCT) administration. Mice were given a single intraperitoneal (i.p.) injection of AOM (10 mg/kg) and then received 2.5% DSS in the drinking water for one week, followed by two weeks of regular drinking water for recovery; this treatment cycle was repeated three times. The sample (LG, CT, or FCT) was administered orally in the CAC mice for 10 weeks. (b) Change of average body weight (g) of the mice in the groups; control mouse (Con), AOM-DSS-induced CAC mouse (AOM/DSS), LG, CT, and FCT. (c) A photograph for measuring and comparing colon lengths of the groups at Week 11. (d) A graph of average colon lengths in the groups at Week 11. (e) Occurrence of colon tumors in the groups. The data present the mean ± standard deviation (SD). Asterisks denote significance vs. AOM/DSS group by one-way ANOVA (*p < .05, **p < .01, ***p < .001). (f) H&E staining of representative histological sections of colons from the groups (200 × magnification).
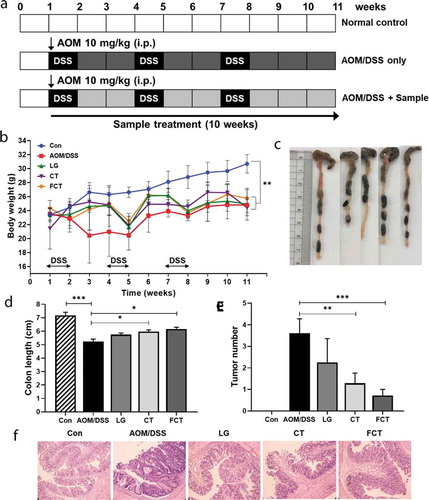
Figure 2. Immune response of the mouse colon by treatment of AOM/DSS and administration of LG, CT, and FCT. (a) mRNA quantification of pro-inflammatory cytokines (TNF-α, IFN-γ, IL-1β, and IL-6) and anti-inflammatory cytokines (IL-4 and IL-10) using Real-Time RT-PCR. (b) Determination of protein productions of the inflammatory cytokines using ELISA. (c) mRNA quantification of iNOS and COX-2 using Real-Time RT-PCR. (d) Determination of protein productions of iNOS and COX-2 using Western blot analysis. The mRNA level was normalized with an mRNA level of GAPDH, and the protein production was normalized with β-actin. The data present the mean ± standard deviation (SD). Asterisks denote significance vs. AOM/DSS group by one-way ANOVA (*p < .05, **p < .01, ***p < .001). The abbreviations of Con, AOM/DSS, LG, CT, and FCT represent the control mice, AOM-DSS-induced CAC mice, L. gasseri 505, C. tricuspidata leaf extract, and fermented CT by L. gasseri 505, respectively.
Figure 3. Recovery of mucus- (MUC2 and TFF3) and colon barrier-associated (occludin and ZO-1) proteins from the colons of the AOM/DSS-induced CAC mice by L. gasseri 505 (LG), C. tricuspidata leaf extract (CT), and fermented CT by L. gasseri 505 (FCT). The abbreviations of Con and AOM/DSS represent the control mice and AOM-DSS-induced CAC mice, respectively. (a) mRNA quantification of MUC2, TFF3, occludin, and ZO-1 using Real-Time RT-PCR with respect to the mRNA level of GAPDH for normalization. (b) Determination of the protein productions using Western blot analysis compared with β-actin production for normalization. The data present the mean ± standard deviation (SD). Asterisks denote significance vs. AOM/DSS group by one-way ANOVA (*p < .05, **p < .01, ***p < .001).
Figure 4. Effects of dietary L. gasseri 505 (LG), C. tricuspidata leaf extract (CT), and fermented CT by L. gasseri 505 (FCT) on the colon tissues of the AOM/DSS-induced CAC mice by determination of pro-apoptosis (p53, p21, and Bax), anti-apoptosis markers (Bcl-2 and Bcl-xL), and tumor cell proliferation markers (β-catenin, NF-κB, and IκBα). (a) mRNA quantification of the apoptosis markers using Real-Time RT-PCR. (b) Determination of the protein productions of the apoptosis markers using Western blot analysis. (c) Determination of the protein productions of the tumor cell proliferation markers using Western blot analysis. The mRNA level was normalized with the mRNA level of GAPDH, and the protein production was normalized with β-actin. The data present the mean ± standard deviation (SD). Asterisks denote significance vs. AOM/DSS group by one-way ANOVA (*p < .05, **p < .01, ***p < .001).
Figure 5. Effects on changes of gut microbiota composition in mice by treatment of AOM/DSS and administration of L. gasseri 505 (LG), C. tricuspidata leaf extract (CT), and fermented CT by L. gasseri 505 (FCT). (a) Compositional analysis of mouse gut microbiota in the groups at Weeks 1, 6, and 11 using 16 S rRNA full sequencing. (b) Compositional analysis of representative beneficial bacteria in mouse gut, Lactobacillus, Bifidobacterium, Akkermansia, and Lactococcus at Week 1, 6, and 11. (c) Principle coordinates analysis (PCoA) plot of the groups at Weeks 1, 6, and 11 with the weighted Unifrac distance matrix.
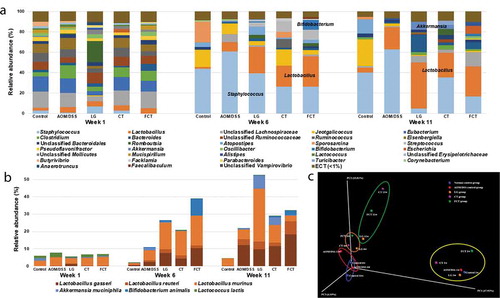
Figure 6. Measurement of short-chain fatty acids (SCFAs), acetate, propionate, and butyrate, in the collected fecal samples using GC-MS at Weeks 1, 6, and 11. The data present the mean ± standard deviation (SD). Asterisks denote significance vs. AOM/DSS group by one-way ANOVA (*p < .05, **p < .01, ***p < .001). The abbreviations of Con, AOM/DSS, LG, CT, and FCT represent the control mice, AOM-DSS-induced CAC mice, L. gasseri 505, C. tricuspidata leaf extract, and fermented CT by L. gasseri 505, respectively.
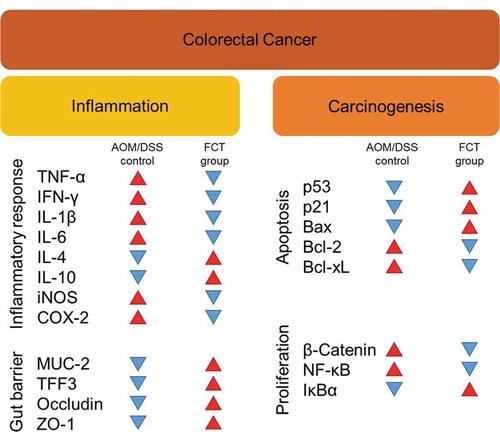
Figure 7. The result summary of AOM/DSS treatment and FCT administration in the mouse model showing that FCT administration to AOM/DSS-induced CAC mouse has regulatory effects on reduction of inflammation, recovery of colon barrier, and enhancement of tumor cell apoptosis, indicating the anticancer effect.