Figures & data
Figure 1. Identification of tryptophan metabolites as novel AHR activators. HepG2 40/6 or Hepa 1.1 cells were treated with each novel tryptophan metabolites identified in either cecal or fecal material to assess AHR activation potential. Cells were lyzed after 4 h and luciferase activity determined. Due to cell line dependent differential basal activity and AHR-dependent induction, data represent mean luciferase activity (background subtracted) expressed as percentage of maximal TCDD-dependent activity. The data are mean ± SEM, ** P < .01, *** P < .001, **** P < .0001.
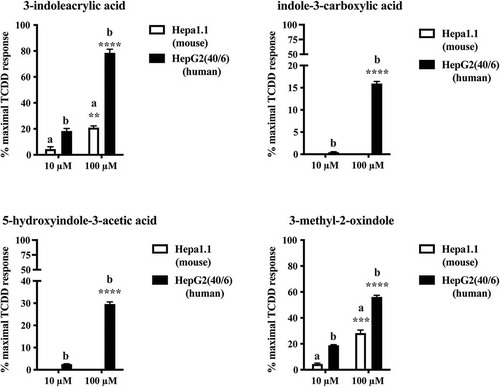
Table 1. Quantification of Trp metabolites in cecal contents of pathogen-free mice.a.
Figure 2. Level of 11 tryptophan metabolites in mouse cecal contents. LC-MS and GC-MS analysis was utilized to quantitate tryptophan metabolites in cecal extracts. (a) Concentration of seven individual tryptophan metabolites in cecal contents of mice on a chow diet. (b) Overall concentration of all measured tryptophan metabolites and percent abundance of each metabolite relative to the overall tryptophan metabolite levels. The data are mean ± SEM.
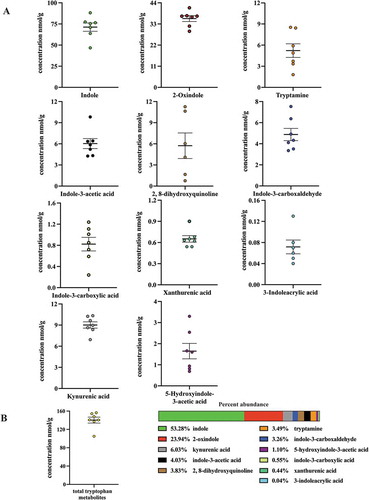
Table 2. Comparison of Trp metabolite concentrations in pathogen-free and GF mice.
Table 3. Quantification of Trp metabolites in defined diet human feces.a.
Figure 3. Level of 12 tryptophan metabolites in human feces. LC-MS and GC-MS analysis was utilized to quantitate tryptophan metabolites in fecal extracts derived from humans on a defined diet. The data are mean ± SEM.
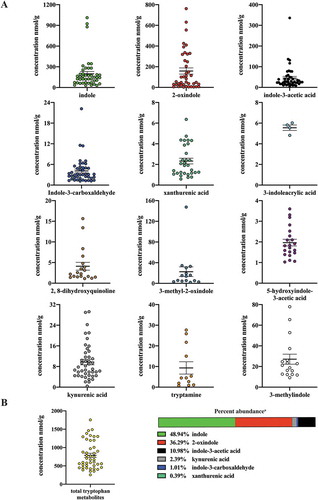
Table 4. Quantification of Trp metabolites in ad lithium diet human fecesa.
Table 5. A compilation of the data presented in , and 4.
Figure 4. Level of 12 tryptophan metabolites in human feces. LC-MS and GC-MS analysis was utilized to quantitate tryptophan metabolites in fecal extracts derived from humans on an ad libitum diet. The data are mean ± SEM.
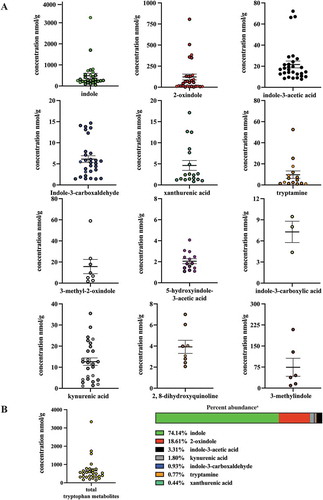
Figure 5. Assessment of AHR transcriptional activity mediated by tryptophan metabolites. Hepa 1 cells were treated for 4 h with tryptophan metabolites at the concentration observed in cecal contents. The data are mean ± SEM, ** P < .01, **** P < .0001.
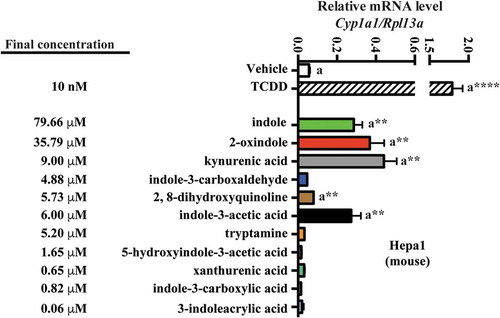
Figure 6. Assessment of AHR transcriptional activity mediated by tryptophan metabolites. Caco2 cells were treated for 4 h with tryptophan metabolites at the concentration observed in defined diet human feces. The data are mean ± SEM, *** P < .001, **** P < .0001.
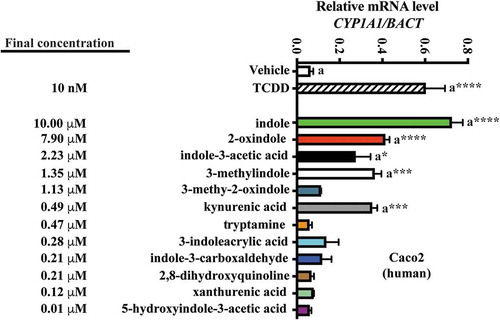
Table 6. Spearman rank correlation between metabolite abundance and AHR activity. Quantifiable tryptophan metabolite abundance represented in >50% of human fecal samples obtained from subjects on a defined or ad libitum diet were correlated against AHR-dependent reporter activity in human HepG2 (40/6) cells through non-parametric Spearman rank analysis. Trp metabolites represent the combined abundance of indicated individual metabolites.
Figure 7. Relative AHR transcriptional activity induced by human fecal extracts. HepG2 40/6 cells were treated with fecal extracts from defined and Ad libitum diet groups and the level of AHR transcriptional activity assessed. The data are mean ± SEM.
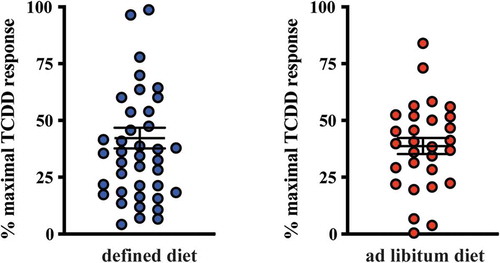
Figure 8. 2-oxindole and major tryptophan metabolites levels pooled together correlated with induced AHR transcriptional activity in human fecal extracts from the defined diet group. Six tryptophan metabolites that were present in more than 50% of the fecal samples and were correlated individually with AHR transcriptional activity induced HepG2 40/6 cell by fecal extracts from each individual. Each graph contains the Pearson r value correlation coefficient and two-tailed p value.
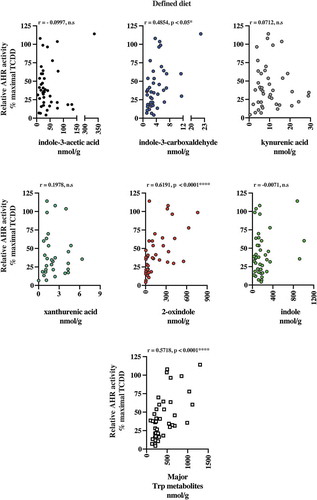
Figure 9. The major tryptophan metabolites levels pooled together correlated with induced AHR transcriptional activity in human fecal extracts from the ad libitum diet group. Six tryptophan metabolites that were present in more than 50% of the fecal samples were correlated individually with AHR transcriptional activity induced HepG2 40/6 cell by fecal extracts. Also, the six metabolites pooled together were correlated with AHR transcriptional activity. Each graph contains the Pearson r value correlation coefficient and two-tailed p value.
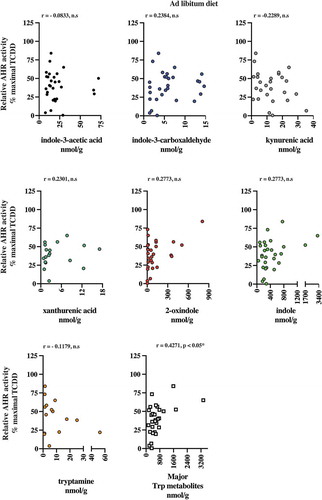
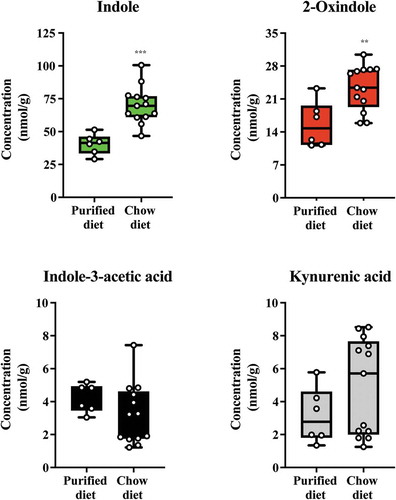
Figure 10. Diet alters levels of indole and 2-oxindole in cecal contents. Mice were fed either a chow or switched to a semi-purified AIN 93 G diet for one week. The levels of indole, 2-oxindole, indole-3-acetic acid and kynurenic acid were determined. Data groups were compared with a Student test. Each box represents the median value with Q1 and Q3 range, whiskers describe the minimal and maximal values. ** P < .01, *** P < .001.