Figures & data
Figure 1. Growth rate scores of six human cell lines upon treatment with bacterial cells and secretomes. (a) Heatmap indicating low and high growth rate scores, respectively red and blue. Bacteria are sorted within bacterial families by the average growth rate score. Red numbered octagons highlight the strains discussed in the text: Bacteroides sp. 2_1_22 (1), B. fragilis K570 clinda R (ETBF) (2), B. sp. 4_1_36 (3), Clostridium septicum (Mace 1889) Ford 1927 (4), C. sp. D5 (5), Escherichia coli D9 (6), Klebsiella sp. 1_1_55 (7), E. coli 4_1_47FAA (8), F. nucleatum DSM 15643 (ATCC 25586) (9), F. nucleatum DSM 20482 (ATCC 10953) (10), F. necrophorum subsp. funduliforme 1_1_36S (11), F. nucleatum subsp. animalis 11_3_2 (12), Lachnospiraceae bacterium 8_1_57FAA (13), L. bacterium 3_1_46FAA (14), Streptococcus bovis 1212 (15), S. bovis 1459 (16), S. bovis 1417 (17), S. bovis 207 (18), Pediococcus acidilactici 7_4 (19), Pseudomonas sp. 2_1_26 (20), D. sp. 6_1_46AFAA (21), Ralstonia sp. 5_2_56FAA (22), Ruminococcaceae bacterium D16 (23), Synergistes sp. 3_1_syn1 (24), Desulfovibrio sp. 3_1_syn3 (25), Propionibacterium sp. 5_U_42AFAA (26), and Eubacterium sp. 3_1_31 (27). Highlighted with asterisks are cases that correspond to the 5% extremes of the z-score distribution. (b) Distribution of the growth rate scores for bacterial cells and secretomes. Histograms show the distribution of the values from the two heatmaps above, indicating that on average bacterial cells exhibit a stronger inhibiting effect when compared to secretomes.
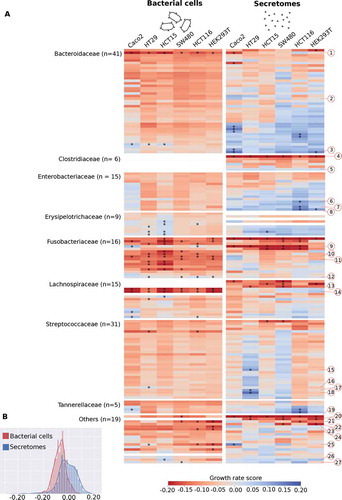
Figure 2. Growth rate alterations of cells lines upon incubation with bacterial cells and secretomes. Distribution plots illustrating effects of (a) bacterial cells and (b) secretomes on cell lines. Negative numbers indicate growth inhibition whereas positive numbers show growth enhancement. The color intensity of the circles represents significance of the effect on growth. (c) Overview of the number of bacterial cells and secretomes significantly enhancing or inhibiting cell growth per tested cell line, sorted by bacterial family. The shading of the bar (arrow pointing upwards) highlights enhancing and unshaded bar (arrow pointing downwards) highlights inhibiting strains. (d) Correlation of number of strains significantly altering growth rates to the number of pathogenic mutations present in cell lines. HEK293T, Caco-2, HT29, SW480, HCT116, and HCT15 were shown to possess 0, 1, 2, 2, 3, and 4 pathogenic mutations, respectively.
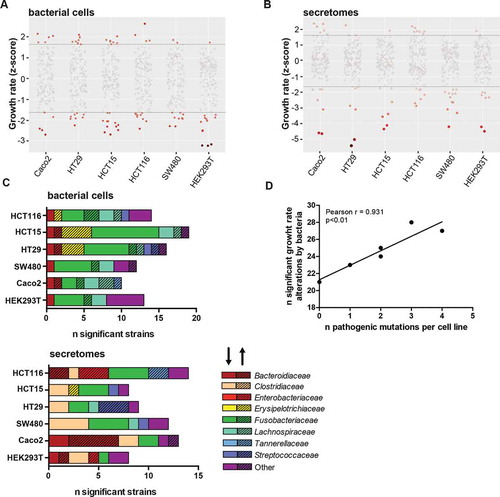
Table 1. Secretomes and bacteria significantly enhancing or reducing cell growth rate (z-scores).
Figure 3. T-SNE plots summarizing the overall growth effects of bacterial cells (a) and secretomes (b) on six human cell lines. Colored circles correspond to strains belonging to particular bacterial families. Magenta and light blue shading around the circles indicate enhancing and inhibiting effects of strains, respectively. Families labeled as “Others” contains the following strains for bacterial cells (A): Lactobacillaceae (1), Peptostreptococcaceae (2), Desulfovibrionaceae (3), Eubacteriaceae (4), Bifidobacteriaceae (5), Enterococcaceae (6), Veillonellaceae (7), Synergistaceae (8), Burkholderiaceae (9), Pseudomonadaceae (10), Propionibacteriaceae (11), Ruminococcaceae (12), Akkermansiaceae (13), Acidaminococcaceae (14). And the following strains for secretomes (B): Lactobacillaceae (1), Eubacteriaceae (2), Clostridiaceae (3), Peptostreptococcaceae (4), Bifidobacteriaceae (5), Enterococcaceae (6), Veillonellaceae (7), Synergistaceae (8), Burkholderiaceae (9), Desulfovibrionaceae (10), Propionibacteriaceae (11), Ruminococcaceae (12), Pseudomonadaceae (13), Akkermansiaceae (14), Acidaminococcaceae (15), Bacillaceae (16).
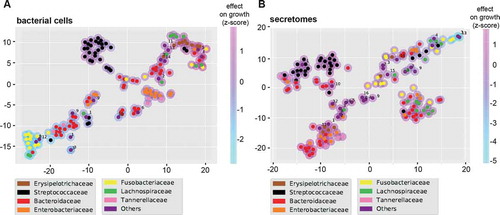
Figure 4. Influence of strains with and without encoded virulence factors on cellular growth rates. B. fragilis (a), Fusobacteriaceae (b), Enterobacteriaceae (c) and Clostridiales (d) encoding the virulence factors bft, fadA, any toxin (Map, pks, ShEt1, Stx2A), and any toxin (TcdA, TcdB, alpha-toxin), respectively, were compared to strains without these encoded virulence factors (Mann-Whitney U test). A trend toward cell growth enhancement was observed for B. fragilis bft+ secretomes (p = .07) (A), while significant inhibition of cell growth was observed for fadA+ Fusobacteriaceae cells (p < .0001), and secretomes (p < .05) (B), for Enterobacteriaceae secretomes encoding toxins (p < .0001) (C), and for Clostridiales secretomes encoding toxins (p < .0001) (D).