Figures & data
Figure 1. Metabolic profile differences in donors and recipients before and after FMT. Principal component analysis (PCA) scores plots ofCitation1H-NMR spectra from fecal water (a) and urine (b) samples from donors (n = 3) and recipients collected at different timepoints (for stool recipient samples: n = 18 for timepoints 0 (pre-FMT), 1, 4 and n = 16 for timepoint 12; for urine: n = 15 for timepoint 0, n = 12 for timepoint 1, n = 13 for timepoints 4 and 12).
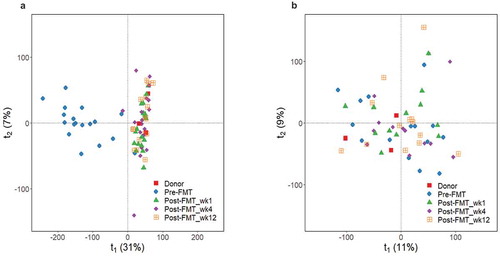
Figure 2. Metabolite changes in fecal water. Area under curve (AUC) of metabolite representative peaks at 0 (pre-FMT) and 12 weeks post-FMT (top; n = 18 for timepoint 0 and n = 16 for timepoint 12), and across all measured time points (bottom; n = 18 for timepoints 0, 1, 4 and n = 16 for timepoint 12). P-values were calculated using paired Wilcoxon signed rank test.
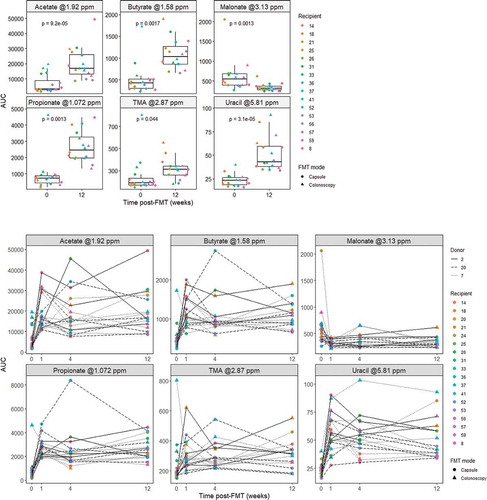
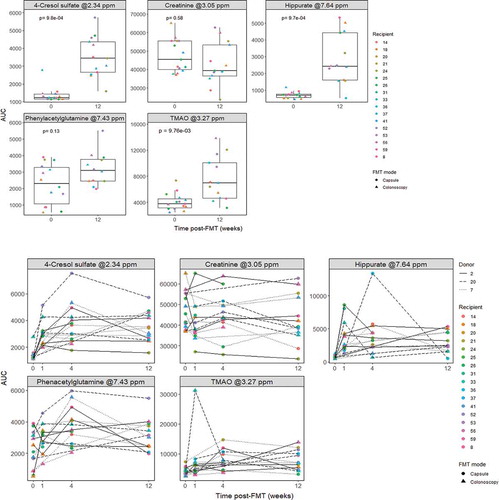
Figure 3. Metabolite changes in urine. AUC of metabolite representative peaks at 0 (pre-FMT) and 12 weeks post-FMT (top; n = 15 for timepoint 0 and n = 13 for timepoint 12), and across all measured time points (bottom; n = 15 for timepoint 0, n = 12 for timepoint 1, n = 13 for timepoints 4 and 12). P-values were calculated using paired Wilcoxon signed rank test.