Figures & data
Figure 1. The time line for the studies in germ-free mice. Following FTG (fecal transplant gavage) mice with young and aged FTG were housed separately in a conventional animal holding room
Figure 2. Principal component analyses (PCAs) of the Aitchison distance, a measure of beta diversity, in mice with young and aged microbiomes at 30, 60, and 90 d after the initial fecal transplant gavage. PERMANOVA F statistics and P value is within each plot. The aged group at 30 d (top panel, depicted by arrow pointing to the group centroid) has data points that cluster into two groups. This clustering is discussed in the manuscript
Figure 3. Differential abundance of taxa from GF mice after fecal transplant gavage with an aged or young gut microbiome. Only taxa showing P < .2 in at least one of the time points were displayed. Statistical analysis was conducted after a centered log-ratio transformation using Kruskal–Wallis test with post hoc Benjamini-Hochberg correction. N = 11 per group. * and ** P < .05 and 0.01 respectively
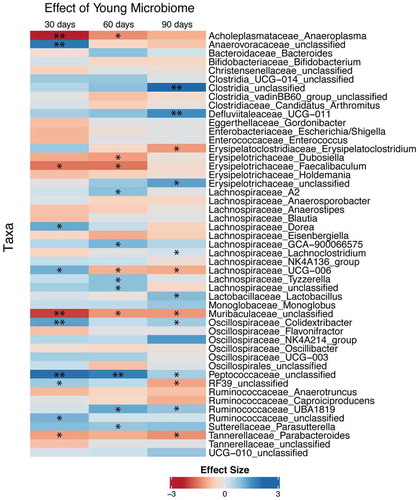
Table 1. Table of enzyme expression showing significant differences between mice with young and aged microbiomes (column 1), day after FTG (fecal transplant gavage) when the significant change in enzyme expression occurred (columns 2, 3, and 4), and bacteria genera that significantly changed for the given day indicated in columns 2–4 with the direction of change in abundance occurring in mice with a young microbiome (column 5)
Figure 4. Heat map of relative abundance for bacterial enzymes used in the metabolism of acetate, propionate, and butyrate. Predictions were made from feces of mice collected 30, 60, and 90 d after the initial fecal transplant gavage using data from 16S ribosomal RNA gene analysis and the software program, PICRUSt2. *, **, and *** P < .05, <0.01, and <0.001 respectively, N = 11 per group)
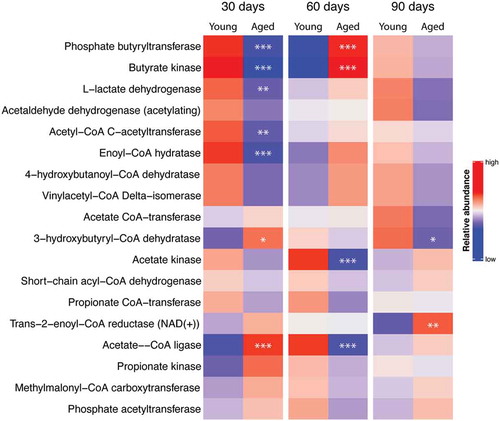
Figure 5. Changes in SCFA concentrations in fecal samples of mice with aged and young gut microbiomes. The “0” time point represents concentrations in the GF mice before fecal transplant gavage. Note the “0” time point was not used in the statistical analysis. Data for individual SCFAs were normalized to the value obtained in the “30 day” group having a young microbiome. Significant main effects of the microbiome (aged or young) when present are shown in each graph. * P < .05 compared to the young microbiome of the same time point (Holm-Sidak post hoc test, N = 11 per group). See Supplemental Table I for more statistical details. Note that the SCFAs in the 30 d aged group showed a dichotomy as described under beta diversity above. Dichotomy in the SCFAs did not occur in any other group
Figure 6. The effects of aged or young gut microbiome on short-term memory recall using the novel object recognition test (NORT). Duration of time spent at the novel object as a percent of the total time. Significant main effect of gut microbiome using 2 way repeated measures ANOVA P < .001, N = 10–11. *, ** P < .05 and <0.01 compared to young biome of the same time (post hoc Holm-Sidak test). See Supplemental Table I for more statistical details. Note: one mouse with an aged microbiome failed to explore at 60 d and was omitted from the analysis
Figure 7. (a) Tail suspension test and (b) Barnes Maze. There was a significant main effect of the gut microbiome (P = .008 and 0.030 for A and B respectively, (N = 9–11). *,** P < .05 and 0.01 compared to young biome at the same time point (Holm-Sidak post hoc analysis). See Supplemental Table I for more statistical details. Note that the time of immobility in the 30 d aged group showed a dichotomy as described in the text. None of the other behavioral tests regardless of time after the initial gavage showed a dichotomy