
Figures & data
Table 1. Participants and specimen description
Figure 1. Rarefaction curves generated from pooled sequences from 3 IBD patients and 3 healthy controls with matching sample triads, i.e. saliva, gastric aspirate, colon/pouch aspirate. Lines are drawn by LOESS (locally estimated scatterplot smoothing), with lighter colored areas surrounding the lines as the standard error intervals. Rarefaction curves averaged across individual samples can be seen in Supplementary Figure 3. The pool of saliva samples is more diverse compared to gastric and colon/pouch samples
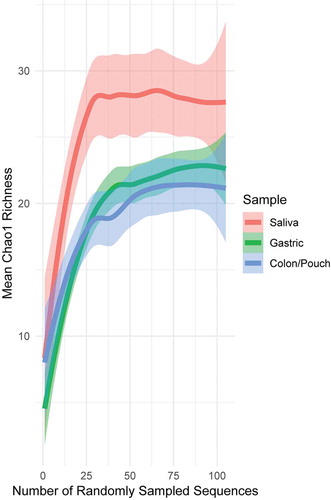
Figure 2. Phylogenetic tree combining the nodes discerned by Minimum Entropy Decomposition (MED) with reference sequences obtained from BLAST. This approach is used to determine the identity of the unknown sequences. Almost all nodes fall into monophyletic clades based on either species or subspecies, which makes phylogeny determination straightforward. The tree is colored by the inferred clades, with names shown to the left of the colored clade
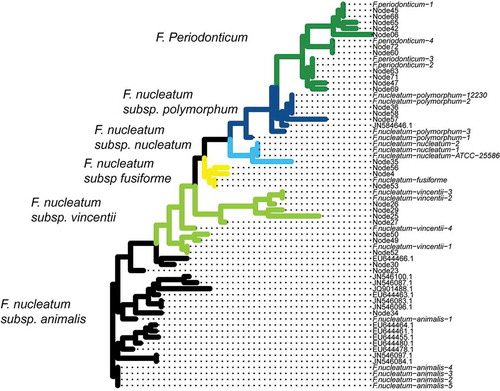
Figure 3. Principle coordinates analysis (PCoA) of Fusobacterium communities of all samples. Each symbol represents the community of one body site from one individual, and the distance between them is based upon the Bray-Curtis dissimilarity. The ellipses drawn around the points represent 95% confidence intervals assuming a multivariate t-distribution for each body site using the six matching sample triads. 1–3, healthy controls; 4–6, IBD patients (see for subject description). The light pink dots are saliva samples from 7 additional IBD patients without matching gastric or colon/pouch aspirates, all of which fall into the pink ellipse, confirming the predicted variability. Based on the variability of these samples, fusobacterial communities are more closely related in the gastric and colon/pouch than in saliva. Using the matching triads (saliva, gastric aspirate and colon/pouch aspirate) from 6 individuals, we found that different body sites harbor significantly different communities (ANOSIM R: 0.3652, p = .003)
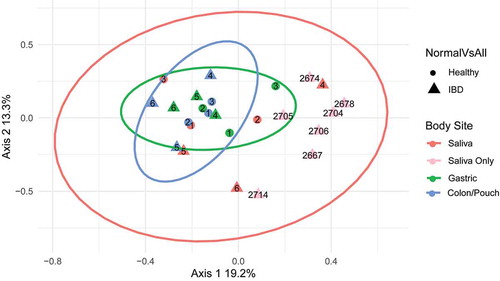
Figure 4. The average Bray-Curtis dissimilarity of Fusobacterium communities between body sites. The median distance between body sites from different individuals is calculated using matched saliva, gastric aspirate, and colon/pouch aspirate samples. For example, the upper-left box is the average dissimilarity of a saliva sample to other saliva samples. The oral Fusobacterium communities are significantly more dissimilar from each other than from the gastric (Mann-Whitney U-Test, p = 0.036) or colon/pouch (Whitney U-Test p = 2.588 10−6) communities, indicating that there is significantly more variation between oral samples than the GI samples
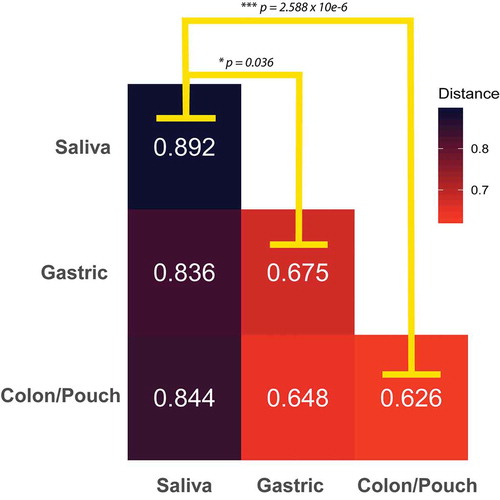
Figure 5. Heatmap of Fusobacterium grouped by body site at the clade level as determined by phylogenetic tree. This corresponds to the subspecies level for F. nucleatum and the species level for F. periodonticum. F. periodonticum is the most abundant clade in each body site. No clades were significantly enriched by the binomial test
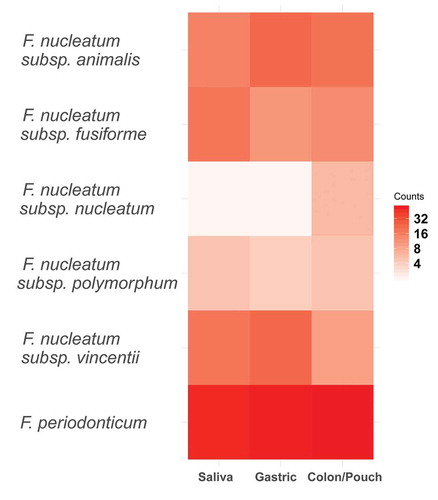
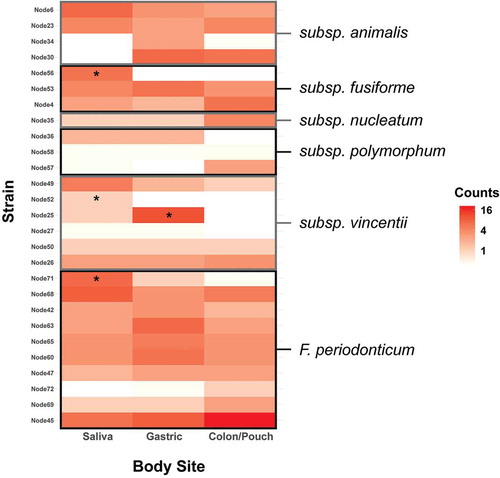
Figure 6. Heatmap of the abundance of distinct Fusobacterium nodes at each body site, grouped by subspecies. Enrichment was tested using the binomial test with a Benjamini-Hochberg correction, and significance is indicated by a star. Individual nodes have differing abundance patterns across body sites. F. nucleatum subsp animalis tends to persist through colon, while subsp vincentii is least likely to colonize the colon. Heatmaps by patients and body sites are shown in Supplementary Figure 4
Supplemental Material
Download Zip (7.8 MB)Data availability statement
Genbank submission reference is SUB7794064. Accession numbers for each individual sequence are MT780937-MT781319.