Figures & data
Figure 1. Symptom changes with oral administration of L. rhamnosus KBL365 or L. paracasei KBL382 in mice with Dermatophagoides farinae extract (DFE)-induced atopic dermatitis (AD)-like symptoms. (A) Experimental design. The mice were treated with DFE for 7 weeks. After 3 weeks from the initial DFE application, mice were fed KBL382 or KBL365 for 4 weeks. Body weight and dermatitis scores were measured at 1-week intervals. (B) Photographs of DFE-induced dermatitis in NC/Nga mice were taken on d 49. Four groups of mice (N = 7–9) were treated with (1) PBS (Control), (2) DFE+PBS, (3) DFE+KBL365, and (4) DFE+KBL382. (C) Dermatitis scores were evaluated once a week for 4 weeks after bacterial administration. (D) Ear and (E) dorsal skin thickness were measured once a week for 4 weeks. Statistical analyses were performed using the Mann–Whitney U-test for comparison with DFE+PBS mice (N = 7–9 mice per group). Error bars represent SEM. * P< .05; ** P< .01; *** P< .001.
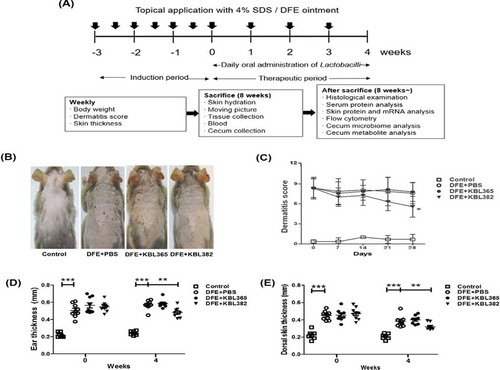
Figure 2. Effects of oral administration of L. rhamnosus KBL365 or L. paracasei KBL382 on epidermal hydration, scratching behavior, and overall immune response in AD mice. To evaluate epidermal hydration, (A) transepidermal water loss (TEWL) and (B) corneometer units were measured. (C) Scratching behavior was observed for 10 min on d 49. (D) The ratio of spleen-to-body weight was calculated on d 49 after sacrifice. (E) The concentration of immunoglobulin (Ig)E in collected serum on d 49 was determined using an ELISA kit. Statistical analyses were performed using the Mann–Whitney U-test for comparison with DFE+PBS mice (N = 7–9 mice per group). Error bars represent SEM. * P< .05; ** P< .01.
Figure 3. Effects of oral administration of L. rhamnosus KBL365 or L. paracasei KBL382 on dorsal skin inflammation in AD mice. Dorsal skin was excised, fixed with 10% formalin, embedded in paraffin, and stained with (A) hematoxylin and eosin, (B) Congo red, and (C) toluidine blue. Arrowheads on the images indicate mast cells and eosinophils, and their numbers are presented in (D) and (E), respectively. Statistical analyses were performed using the Mann–Whitney U-test for comparison with DFE+PBS mice (N = 7–9 mice per group). Error bars represent SEM. * P< .05; ** P < .01.
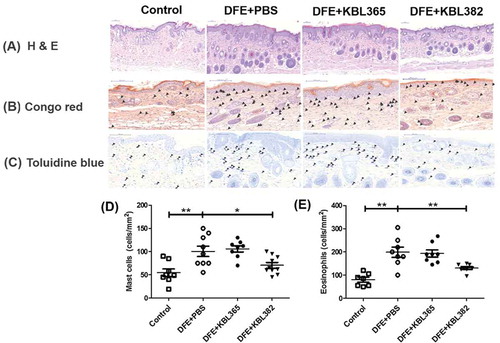
Figure 4. Effects of oral administration of L. rhamnosus KBL365 or L. paracasei KBL382 on innate cytokine and chemokine expression in the skin of AD mice. (A) Thymic stromal lymphopoietin (TSLP), (B) thymus and activation regulated chemokine (TARC) and (C) macrophage-derived chemokine (MDC) were analyzed through real-time PCR. Statistical analyses were performed using the Mann–Whitney U-test for comparison with DFE+PBS mice (N= 7–9 mice per group). Error bars represent SEM. * P< .05; ** P< .01.
Figure 5. Effects of oral administration of L. rhamnosus KBL365 or L. paracasei KBL382 on Th1, Th2, Th17, and anti-inflammatory cytokine production in the skin of AD mice. Protein levels of the T helper (Th)2-type cytokines (A) interleukin (IL)-4, (B) IL-5, and (C) IL-13, Th1-type cytokine (D) IFN-γ, Th17-type cytokine (E) IL-17A, and anti-inflammatory cytokine (F) IL-10 were measured using a multiplex magnetic Luminex kit. Total RNA was extracted from skin and mRNA expression levels of cytokine genes related to Th1-type (G) IL-2, Th2-type (H) IL-31, anti-inflammatory cytokine (I) TGF-β and regulatory T cell (Treg) marker (J) Foxp3 were evaluated using real-time PCR. Statistical analyses were performed using the Mann–Whitney U-test for comparison with DFE+PBS mice (N= 7–9 mice per group). Error bars represent SEM. * P< .05; ** P< .01.
Figure 6. Effects of oral administration of L. rhamnosus KBL365 or L. paracasei KBL382 on Treg in mesenteric lymph nodes (MLNs) of AD mice. The MLN cells isolated from NC/Ng mice in Control, DFE+PBS, KBL365-treated, and KBL382-treated mice. (A and B) The number of CD4+ CD25+ Foxp3+ cells was calculated based on the percentage of total MLN cell counts. Statistical analyses were performed using the Mann–Whitney U-test for comparison with DFE+PBS mice (N= 7–9 mice per group). Error bars represent SEM. * P< .05.
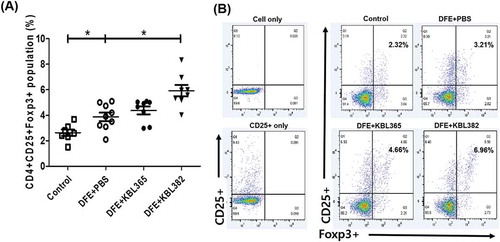
Figure 7. Effects of oral administration of L. rhamnosus KBL365 or L. paracasei KBL382 on the cecal microbiota of AD mice. Microbiome analyses were carried out using cecal samples from 7–9 mice per group. (A) Average relative abundances of taxa at the genus level. (B) Rarefaction plots based on the chao1 and phylogenic diversity (PD) indexes. (C) Principal component analyses of cecal microbiota structure based on weighted UniFrac distance. (D) Significantly different taxa among Control (green), DFE+PBS (yellow), and DFE+KBL382 (blue) samples, as determined using LEfSe analyses (LDA-score >2.5). (E) Comparison of relative abundances of significantly different microbial taxa at the genus level. Statistical analyses were performed using the Mann–Whitney U-test with no false discovery rate (FDR)-correction for comparison with DFE+PBS mice (N= 7–9 mice per group). Error bars represent SEM. * P< .05; ** P< .01; *** P< .001.
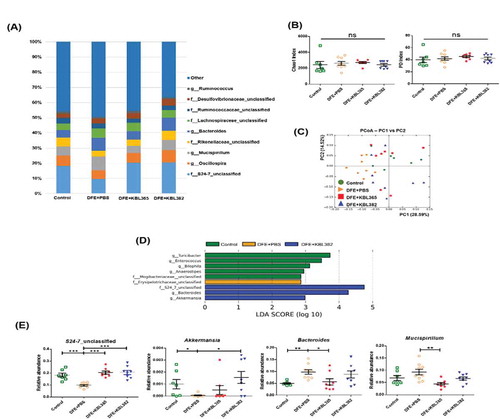
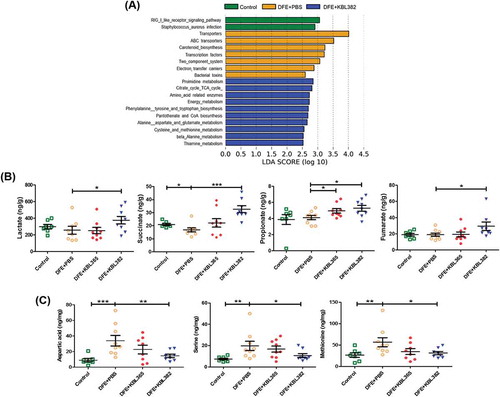
Figure 8. Effects of oral administration of L. rhamnosus KBL365 or L. paracasei KBL382 on cecal metabolites of AD mice. (A) Significant changes in functional profiles were suggested based on phylogenetic investigations of communities through reconstruction of unobserved data and LEfSe analyses with the Kyoto Encyclopedia of Genes and Genomes (KEGG) pathway database (LDA-score > 2.5). (B) Analyses of nonvolatile acids and short-chain fatty acid using gas chromatography. (C) Analyses of amino acids using ultra-performance liquid chromatography. Statistical analyses were performed using the Mann–Whitney U-test with no FDR correction for comparison with DFE+PBS mice (N= 7–9 mice per group). Error bars represent SEM. * P< .05; ** P< .01; *** P< .001.