Figures & data
Figure 1. In vitro synthesis of SCFA by zebrafish gut microbiota. Concentrations of short-chain fatty acids (SCFA) synthesized by conventional microbiota harvested from adult zebrafish intestines. SCFA content of nutrient media used to culture microbes is provided under “Negative”. Asterisks indicate measurements within the range of standards. Error bars are shown as mean ± SE, n = 2. Bars without an asterisk indicate concentrations that were outside the standard range but were detectable.
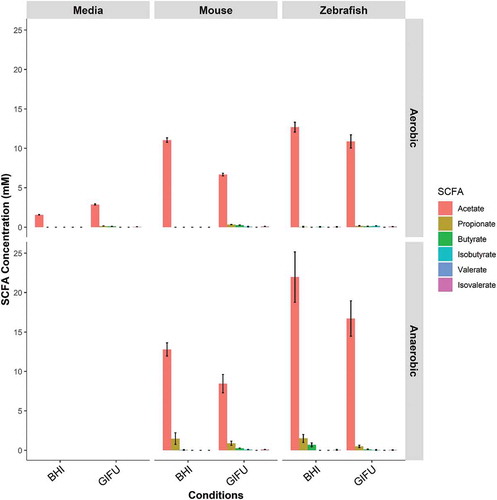
Figure 2. Butyrate reduces the recruitment of zebrafish neutrophils to a wound. (a) Cartoon describing the standard cut site transecting the dorsal aorta and cardinal vein of a 5 dpf zebrafish embryo, and the fin cut site used for live imaging studies. (b) Neutrophil counts at 6 hpw. Each dot represents a single embryo. Embryos were immersed in 30 mM SCFAs or 50 µg/mL dexamethasone. (c) Velocity of wound-recruited neutrophils calculated from live imaging studies. Each dot represents the average of 10 neutrophils from a single embryo. (C) Meandering index (Total distance/Euclidean distance) of wound-recruited neutrophils calculated from live imaging studies. Each dot represents the average of 10 neutrophils from a single embryo. (d) Neutrophil count at 6 hpw in 2 dpf zebrafish.
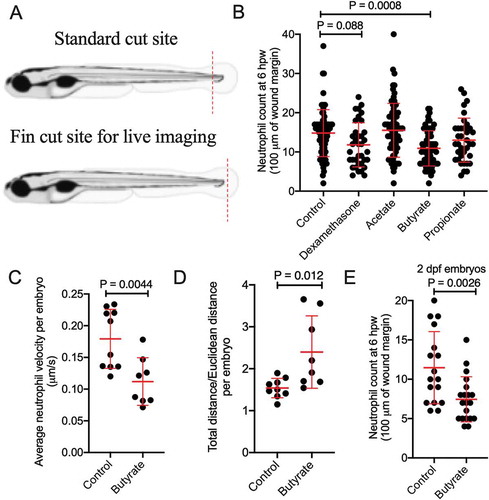
Figure 3. Butyrate reduces macrophage recruitment to the wound site and pro-inflammatory differentiation. (a) Macrophage fluorescent area at 6 hpw. (b) Macrophage fluorescent area at 24 hpw. (c) Total tnfa promotor fluorescent area at the wound site after 24 hpw. (d) Representative images of double transgenic red macrophage, green tnfa promoter activity embryos tail wounds at 24 hpw. Scale bar represents 100 µm. (D) Quantification of wound site tnfa expressing macrophages at 24 hpw.
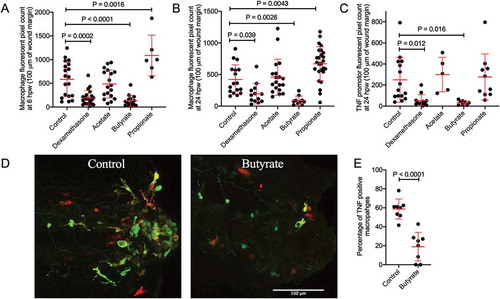
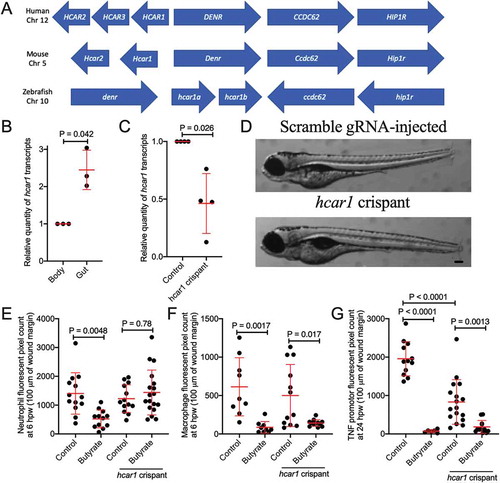
Figure 4. Characterization of zebrafish hydrocarboxylic acid receptor 1 and responsiveness to butyrate. (a) Synteny diagram illustrating HCAR1 in a conserved region of human chromosome 12, mouse chromosome 5, and zebrafish chromosome 10. (b) Quantification of hcar1 expression in dissected gut and body of zebrafish embryos. Each dot represents a biological replicate of at least 10 embryos. (c) Quantification of hcar1 expression in 5 dpf embryos injected with hcar1-targeting Crispr-Cas9 complexes. Each dot represents a biological replicate of at least 10 embryos. (d) Morphology of the control and crispant embryos. Scale bar represents 100 µm. (e) Quantification of neutrophil area at 6 hpw in control and crispant embryos exposed to butyrate by immersion. (E) Quantification of macrophage area at 6 hpw in control and crispant embryos exposed to butyrate at 6 hpw. (f) Total tnfa promotor-driven fluorescent area at the wound site at 24 hpw.