Figures & data
Figure 1. Microbiota composition and stability in neonates with or without probiotic supplementation. (a) Infographic of study outline (n = 51–66 per group for all subsequent cohort-analyses) (b) Microbial richness (number of ASVs) shows a gradual increase with age for all groups (linear regression: pfor trend<0.0001, pfor trend = 0.01, pfor trend = 0.0021 for controls, probiotic1, probiotic2, respectively). (c) Principal Coordinate Analysis (PCoA) based on ASV-derived Bray-Curtis dissimilarity exhibiting differences in microbial community structure between control and probiotic groups at T1 (p < 0.001, Permanova). (d) Bray-Curtis distance compared to T1 at T1 (within group distance). (e,f) PCoA between control and probiotic groups at T2 (p < 0.001, Permanova) (e), and at T3 (p < 0.001, Permanova) (f). (g,h) Bray-Curtis distance compared to T1 at T2 (g), and at T3 (h). (Kruskal-Wallis test with Dun’s test for post-hoc comparisons (control-group is reference), mean and SD; ****, p < 0.0001)
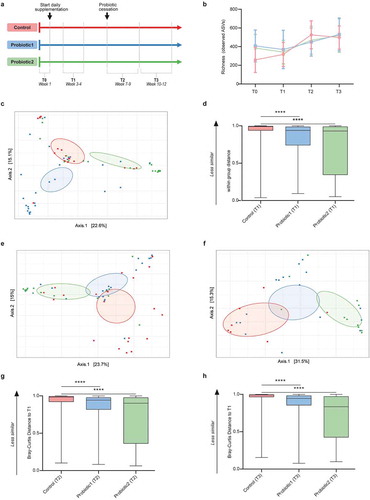
Figure 2. Association of probiotic administration with specific taxa. (a) Principal Component Analysis (PCA) illustrating the separation between the control and probiotic groups at T1-T3. Vectors depict the five genera that explained most of the variation in microbial community structure (b) Relative abundances of the five genera over time for the three different groups. (c) Linear discriminant analyses with Effect Size (LEfSe) were employed to identify differentially abundant bacterial genera between probiotic 1 supplemented and control neonates at T1, (d) at T2, (e) and at T3. (f) LefSe between probiotic 2 supplemented and control neonates at T1, (g) at T2, (h) and at T3 (LDA-score >0.2 and p < 0.05, Wilcoxon signed-rank test)
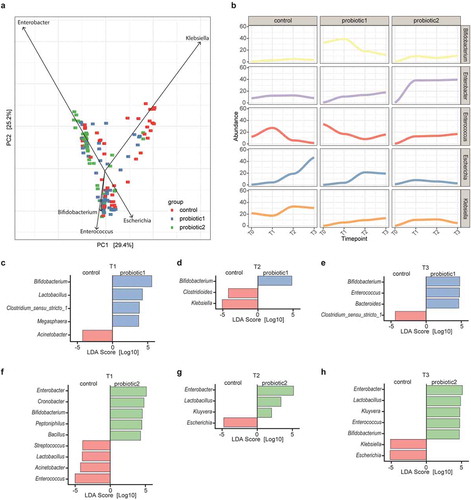
Figure 3. Association of probiotic administration with the detection of probiotic species. (a-l) Quantitative abundance (log10 copies/ng DNA) during probiotic supplementation at T1, after cessation of probiotic supplementation at T2 and T3 respectively of the probiotic bacteria Bifidobacterium longum/infantis (a-c), Bifidobacterium lactis (d-f), Lactobacillus acidophilus (g-i), Lactobacillus casei (j-l). (Kruskal-Wallis test with Dun’s test for posttest comparisons (control-group is reference), mean and SD; *, p < 0.05; **, p < 0.01; ***, p < 0.001;****, p < 0.0001; ns, not significant)
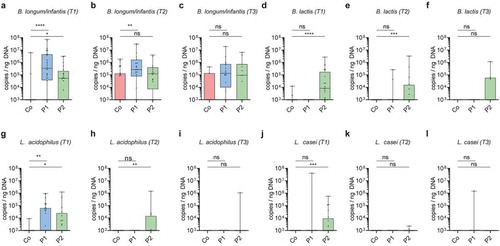
Figure 4. Colonization by probiotic bacteria after cessation of supplementation. (a-f) Colonization pattern from longitudinally sampled neonates (n = 8/group) after cessation of probiotic supplementation for probiotic specific ASV-tracked (a) B. infantis in probiotic 1 supplemented neonates; (b) B. longum in probiotic 2 supplemented neonates, (c) qPCR-tracked Lactobacillus acidophilus in probiotic 1 supplemented neonates; qPCR-tracked (d) Lactobacillus acidophilus, (e) Bifidobacterium lactis, (f) and Lactobacillus casei in probiotic 2 supplemented neonates. Categorized into ‘persistent’ colonizers (first two weekly timepoints after cessation were positive for probiotic strains), ‘transient’ (sample collected in the first two weeks after cessation was positive, but subsequent sample was negative) and ‘absent’ (first timepoint upon probiotic cessation was negative for probiotic bacteria)
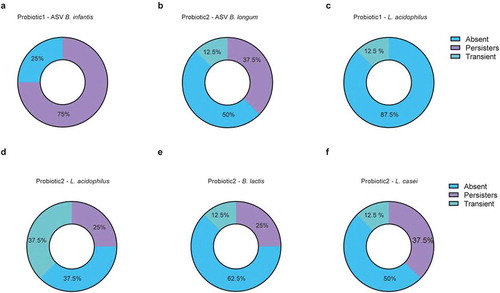
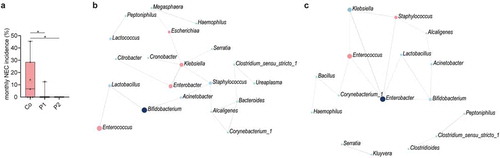
Figure 5. Probiotic intake may prevent necrotizing enterocolitis by interfering with pathobionts. (a) Monthly NEC-incidence during the 2-year study period among all preterm born neonates (n = 179, gestational age<32 weeks) stratified according to supplementation group. In total, 9, 1, and 0 NEC cases were diagnosed in the control group, P1 group and P2 group, respectively. (b) SparCC correlation network analyses with genera at T1 in the probiotic 1 supplemented, (c) and probiotic 2 supplemented neonates as compared to control neonates (correlation >0.3, p < 0.05). Blue circles indicate genera with an increased abundance in probiotic groups, while red circles represent genera enriched in control neonates. Red lines indicate negative correlations, while blue lines indicate positive correlations