Figures & data
Figure 1. Gene and cellular pathways modulation by F. prausnitzii SN. (a) Comparison of the genes modulated by LYBHI+TNF-α vs TNF-α and SN+TNF-α vs TNF- α. The genes specifically modulated by SN and linked to inflammatory pathways have been represented using IPA canonical pathway display: y-axis displays the -log of the p-value which is calculated by Fisher’s exact test right-tailed. The orange points interconnected by a thin line represent the ratio. This ratio is calculated as follows: # of genes in a given pathway that meet the cutoff criteria, divided by the total # of genes that make up that pathway and that are in the reference gene set. (b) IPA canonical pathway display of the genes modulated in the comparison LYBHI+TNF-α vs SN+TNF-α: y-axis displays the -log of p-value which is calculated by Fisher’s exact test right-tailed. The orange and blue colored bars indicate predicted pathway activation, or predicted inhibition, respectively (z-score). Only genes with z-score are represented. The orange points interconnected by a thin line represent the ratio. (c) Histogram of the ten most up- and downregulated genes in the comparison LYBHI+TNF-αvs SN+TNF-α
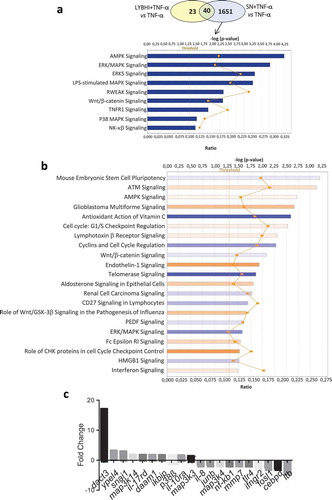
Figure 2. F. prausnitzii SN modulates Dact3 expression in vitro. (a) Schematic representation of Dact3 pathway. (b) RT-qPCR validation of most up- and downregulated genes by F. prausnitzii SN in TNF-α-stimulated HT-29 cells. Results are expressed as the fold change (FC) of gene expression relative to the B2M housekeeping gene
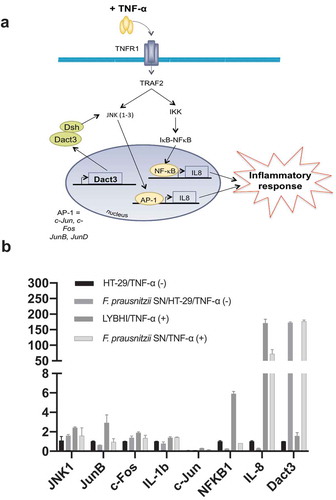
Figure 3. Modulation of Dact3 expression in TNF-α-stimulated HT-29 cells under different conditions. (a) Dact3 expression and (b) IL-8 production by HT-29 cells transfected with either Dact3 or non-targeting (NT) siRNA and treated with both F. prausnitzii SN and TNF-α. Dact3 expression was analyzed by RT-qPCR and IL-8 production by ELISA. Results are represented as the FC of Dact3 expression relative to LYBHI with NT siRNA and IL-8 have been normalized to DMEM medium (used as a control) under NT siRNA conditions (values for DMEM+TNF-a conditions were set to 100%). (c) Dact3 expression and (d) IL-8 production by TNF-α-stimulated HT-29 cells co-incubated with 0.5 µM of TSA or 12.5 µM of DZNep, or both. Results are represented as the FC of Dact3 expression relative to LYBHI and IL-8 values have been normalized to control DMEM. All experiments were performed in triplicate. Non-parametric Kruskal-Wallis and Dunn’s post hoc test *p < .05; **p < .01; ***p < .001
Figure 4. Effect of butyrate on Dact3 expression. (a) Dact3 expression and (b) IL-8 production by HT-29 cells co-incubated with 1 mM of butyrate. Results are represented as the FC of Dact3 expression relative to LYBHI and IL-8 have been normalized to DMEM. All experiments were performed in triplicate. Non-parametric Kruskal-Wallis and Dunn’s post hoc test *p < .05; **p < .01; ***p < .001. (c) Dact3 expression and (d) IL-8 production in TNF-α-stimulated HT-29 cells and treated with the SN of different bacterial strains producing or not butyrate. LYBHI and MRS were used as negative control of the SN from the different bacterial strains. Results are expressed as the FC of Dact3 expression relative to LYBHI and IL-8 have been normalized to DMEM. All experiments were performed in triplicate. Non-parametric Kruskal-Wallis and Dunn’s post hoc test *p < .05
Figure 5. Modulation of Dact3 expression in vivo by F. prausnitzii SN. Animals were intragastrically administered with either butyrate (1 mM) F. prausnitzii SN or R. intestinalis SN and sacrificed 9 after. (a) Quantification of butyrate in samples from proximal colon of treated mice. (b) FC of Dact3 expression in colonic samples relative to actin housekeeping gene. Non-parametric Kruskal-Wallis and Dunn’s post hoc test *p < .05
Figure 6. Modulation of Dact3 expression in vivo by F. prausnitzii. (a) Experimental protocol used for the analysis of the in vivo effects of F. prausnitzii in a mouse model of chronic inflammation (as previously describedCitation8): (b) Macroscopic scores; (c) MPO activity; (d–g) colonic pro-inflammatory cytokine and chemokine concentrations and (h) FC of Dact3 expression in colonic samples relative to actin housekeeping gene. Non-parametric Mann-Whitney U test *p < .05
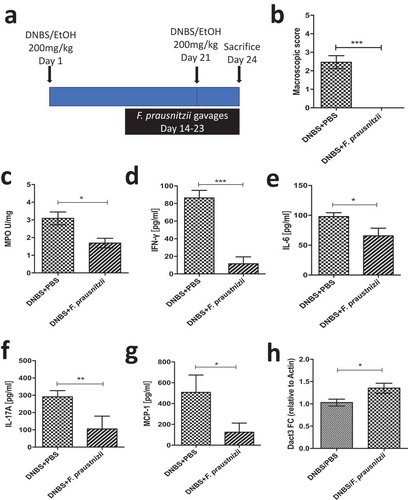
Figure 7. Dact3 modulation by endogenous microbiota. Total RNA was extracted from colon tissues of both germ-free and conventional (Conv) mice and analyzed by microarrays to determine modulation of Dact3.