Figures & data
Figure 1. A comparative genome analysis of the B. uniformis JCM13288T with the B. uniformis JCM 5828 (ATCC 8492). The tracks (outside to inside) represent (i) density of protein-coding genes per 5 kb, (ii) location of PULs, (iii) CAZymes, (iv) transposases and (v) the synteny between the two genomes. The PULs responsible for laminarin utilization are marked in yellow (GH3, GH158, and GH16) and green (GH30_3) and the PUL responsible for porphyran is marked in black. The B. uniformis JCM13288T has five plasmid-like sequences that contain genes for several glycosyl transferases.
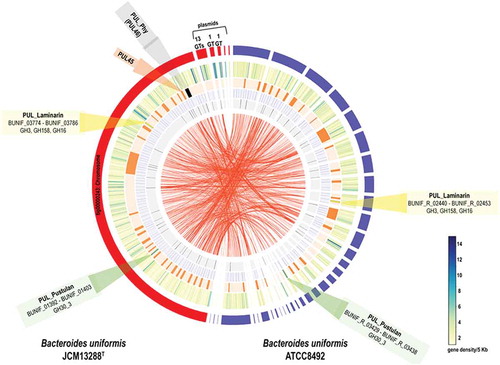
Figure 2. Annotated polysaccharide utilization locus (PUL) and bacterial growth patterns. Illustration of laminarin, fungal glucans and agarose- porphyran utilization genes orientation with their relative sizes (A, B, and C). (c) Comparison of synteny and integrative conjugative element of the B. uniformis JCM13288T and Bacteroides plebeius DSM 17135, highlighting the presence of extra PUL (PUL45) adjacent to porphyran utilization locus without disrupting its function. (d) schematic representation of several glycans used in the study. (e and f) growth patterns of both Bacteroides uniformis strain on different substrates. Three independent replicates were used for growth performance. Graph represent average value of three independent replicates with standard errors.
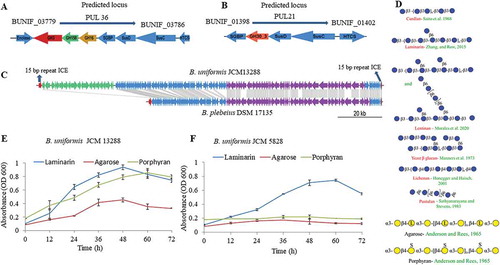
Table 1. Kinetic parameters for the hydrolysis of various substrates by GH158 and GH30.
Figure 3. Hydrolysis of different β- glucans and Michaelis-Menten kinetics of BuGH30_3. (a) Michaelis-Menten plot demonstrating the enzyme kinetic of laminarin. (b) Michaelis-Menten plot demonstrating the enzyme kinetics of gentio-oligosaccharides and pustulan. (c) Michaelis-Menten plot demonstrating the enzyme kinetics of lentinan LMW and HMW. (d and e) Thin layer chromatography analysis was carried out on Silica Gel 60 F254 (Merck) and generated mono- and oligo-saccharides from different substrates were visualized by spraying TLC with 5% H2SO4 in ethanol, followed by charring. Kinetics curves were analyzed on GraphPad Prism software. Three independent replicates were used for Michaelis-Menten kinetics. Bar represent average value of three independent replicates with standard errors.
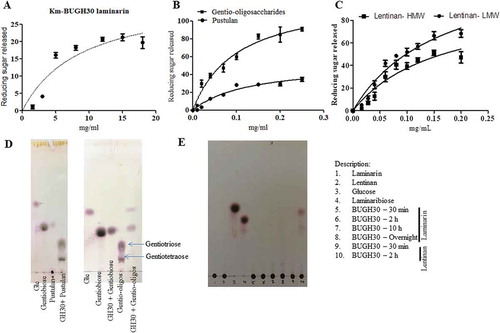
Figure 4. (a) Hydrolysis of different β- glucans and Michaelis-Menten kinetics of BuGH158. (b) Thin layer chromatography analysis was carried out on Silica Get 60 F254 (Merck) and generated mono- and oligo-saccharides were visualized by spraying TLC with 5% H2SO4 in ethanol, followed by charring. Kinetics curves were analyzed on GraphPad Prism. MALDI-TOF mass spectrum was performed in positive ion mode of enzymatic products from laminarin (c) and lichenin (d). All masses were observed with sodium attached molecular mass [M+ Na]+. Three independent replicates were used for Michaelis-Menten kinetics. Bar represent average value of three independent replicates with standard errors.
![Figure 4. (a) Hydrolysis of different β- glucans and Michaelis-Menten kinetics of BuGH158. (b) Thin layer chromatography analysis was carried out on Silica Get 60 F254 (Merck) and generated mono- and oligo-saccharides were visualized by spraying TLC with 5% H2SO4 in ethanol, followed by charring. Kinetics curves were analyzed on GraphPad Prism. MALDI-TOF mass spectrum was performed in positive ion mode of enzymatic products from laminarin (c) and lichenin (d). All masses were observed with sodium attached molecular mass [M+ Na]+. Three independent replicates were used for Michaelis-Menten kinetics. Bar represent average value of three independent replicates with standard errors.](/cms/asset/b3b42636-ee66-41ce-adbe-2ea4bb5e22a8/kgmi_a_1826761_f0004_oc.jpg)
Figure 5. Generation of different β-1, 3- oligosaccharides (β-1, 3-OSs) and characterization. (a) Generation of β-1, 3-OSs and final product after purification on thin layer chromatography. (b) MALDI-TOF mass spectrum analysis of purified β-1, 3-OSs. All masses were observed with sodium attached molecular mass [M+ Na]+. (c) 1H-13C heteronuclear single quantum coherence spectroscopy of purified β-1, 3-OSs.
![Figure 5. Generation of different β-1, 3- oligosaccharides (β-1, 3-OSs) and characterization. (a) Generation of β-1, 3-OSs and final product after purification on thin layer chromatography. (b) MALDI-TOF mass spectrum analysis of purified β-1, 3-OSs. All masses were observed with sodium attached molecular mass [M+ Na]+. (c) 1H-13C heteronuclear single quantum coherence spectroscopy of purified β-1, 3-OSs.](/cms/asset/d1c01f2e-014c-4c6b-8432-43415a7990a4/kgmi_a_1826761_f0005_oc.jpg)
Figure 6. Evaluation of cooperative benefits of polysaccharide digestion by outer surface attached enzymes. (a) Growth of different bacteria in mono and co-culture on agar Petri-plates, and (b) Growth of different bacteria on purified β-1, 3- oligosaccharides generated by BuGH158. The Blautia producta JCM 1471 T, Ruminococcus faecis JCM 15917 T, Bifidobacterium pseudocatenulatum JCM 1200 T, Bifidobacterium adolescentis JCM 1275 T and Anaerostipes caccae JCM 13470 T were used. Three independent replicates were used for each experiments. Results of mono and co-culture analyses were statistically analyzed through t-test (significance level at p < .05).
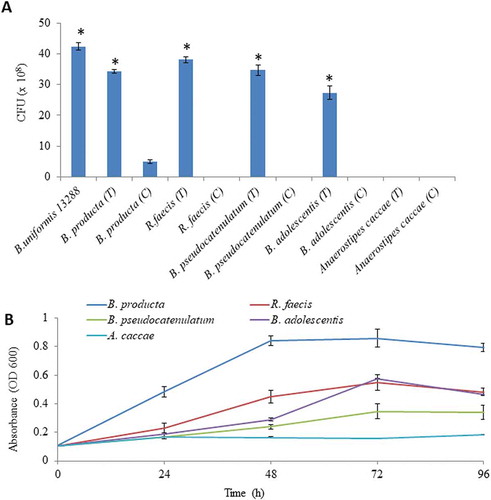
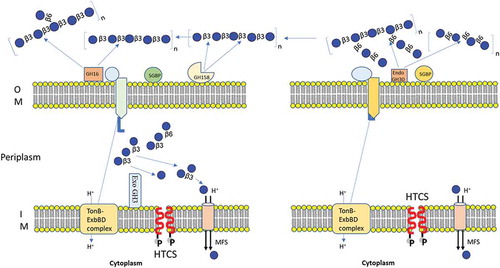
Figure 7. Schematic model of the laminarin and pustulan utilization pathways. Prediction of cellular location of proteins were based on TMHMM Server, v. 2.0 and SignalP, v. 4.1.Citation42 (a) Initial degradation of laminarin takes place by two outer membrane anchored proteins (BuGH158 and BuGH16), which transform polysaccharides into β-1, 3-OSs before importing them into the periplasmic space. The SGBP is involved in capturing of β-1, 3-OSs, which were generated after cleaved by BuGH158 or BuGH16 from curdlan, laminarin, lentinan or lichenin. SGBP provides access of these oligosaccharides to SusCD complex, which eventually imports β-1, 3-OSs into periplasmic space. A BuGH3 is present in the periplasm that converts β-1, 3-OSs in to monomers before sending them to the cytoplasm via the Major Facilitator Superfamily (MFS) transporter. (b) Initial degradation of pustulan takes place by BuGH30_3 that cleaves β-1, 6- linked polysaccharides (pustulan and lentinan) into β-1, 6-OSs with the help of SGBP (65% homologous to Bacteroides thetaiotaomicron VPI-5482) and then imports them into the periplasmic space via the SusCD complex. Latter locus lacks exo-acting enzyme, therefore, we hypothesized that it may utilize via an enzyme (BuGH3) expressed in laminarin- PUL.