
Figures & data
Figure 1. Oral treatment with WIP alleviates chronic ethanol feeding-induced hepatic injury and steatosis
(a) Experimental design. (b) The level of plasma alanine aminotransferase (ALT). (c) The level of plasma aspartate aminotransferase (AST). (d) The plasma levels of alkaline phosphatase (ALP). (e) The level of plasma lactate dehydrogenase (LDH). (f) Liver index. (g) The level of hepatic triglyceride (TG). (h) The level of hepatic total cholesterol (TC). (i) The expression of TNF-α in liver. (j) Representative picture of liver sections stained with oil-red. (k) Representative picture of liver sections with MCP-1 immunofluorescence staining. (b-h) N = 10 per group, (i) N = 5 per group, (j-k) N = 3 per group. Control: mice received isocaloric liquid diet instead of ethanol. Alcohol: mice fed with ethanol diet. WIP: mice fed with an ethanol diet supplemented with a water-insoluble polysaccharide from W. cocos. Data are presented as the mean ± standard error of the mean (SEM). Statistical analysis was done using one-way ANOVA followed by the Tukey post hoc test. Compare to Alcohol: * P < .05; ** P < .01; *** P < .001; **** P < .0001.
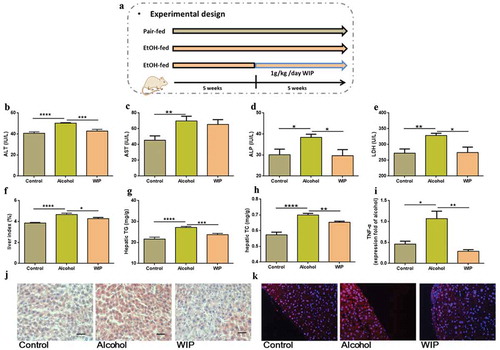
Figure 2. WIP treatment ameliorates the ethanol-induced gut dysbiosis
(a) OTU Venn diagram. (b) Weighted uniFrac-based principal coordinates analysis. (c) Shannon index. Bacterial taxonomic profiling of intestinal bacteria from different groups at the phylum (d) and family level (e). (f, g) Linear discriminant analysis (LDA) scores derived from LEfSe analysis. (h-k) Differentially abundant bacterial genera. The relative expression of occludin-1 (l) and ZO-1 (m) in colon. (n) The level of plasma lipopolysaccharide (LPS). (o) Total fungi in feces assessed by qPCR. The relative expression of ppar-γ (p) and nos2 (q) and colon TNF-α (r) and IL-Iβ (s). (a-k and n) N = 8 per group, (l-s) N = 5 per group. Control: mice received an isocaloric liquid diet instead of ethanol. Alcohol: mice fed with ethanol diet. WIP: mice fed with an ethanol diet supplemented with a water-insoluble polysaccharide from W. cocos. Data are presented as the mean ± standard error of the mean (SEM). Statistical analysis was done using one-way ANOVA followed by the Tukey post hoc test. Compare to Alcohol: * P < .05; ** P < .01.

Figure 3. Identification of Meyerozyma guilliermondii as a casual fungus for AHS
(a) Fungi isolated from feces by aerobic culture-dependent approach. The number in the parentheses represented the strains obtained for each identified fungus. (b) Level of Meyerozyma guilliermondii (Mg) in fecal samples based on aerobic culture-dependent approach. (c) Abundance of Meyerozyma in Cecal contents based on ITS1 sequencing. (d) Experimental design. (e) The level of plasma alanine aminotransferase (ALT). (f) The level of plasma aspartate aminotransferase (AST). (g) The level of hepatic triglyceride (TG). (h) Representative picture of liver sections stained with oil-red. (i) The level of plasma triglyceride (TG). (j) The level of hepatic total cholesterol (TC). (k) The level of TNF-α in the liver. (l) The level of plasma β-glucan. (c) N = 4–5 per group, (e-g and i-l) N = 7–9 per group, (h) N = 3 per group. Ampho B: amphotericin B. Data are presented as the mean ± standard error of the mean (SEM). Statistical analysis was done using one-way ANOVA followed by the Tukey post hoc test. Compare to control: # P < .05; ## P < .01; ### P < .001; #### P < .0001, Compare to Mg: * P < .05; ** P < .01, *** P < .0001.
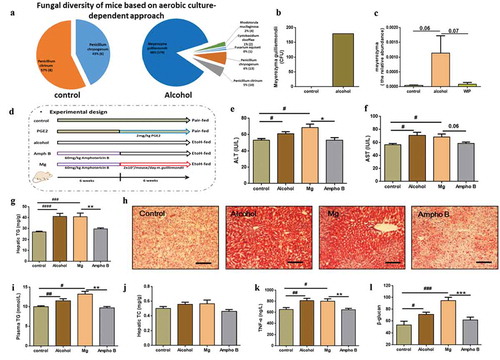
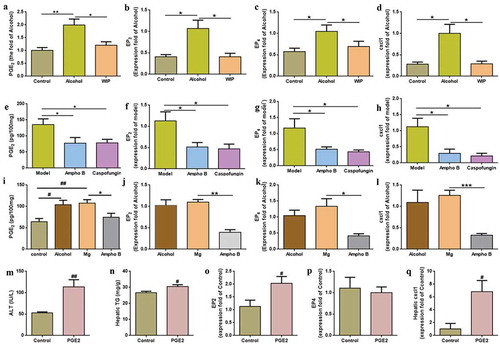
Figure 4. Contribution of fungi-induced PGE2 to alcoholic hepatic steatosis
The level of PGE2 (a), the expression of EP2 (b), EP4 (c) and cxcl1 (d) in liver of ethanol-fed mice treated with WIP. The level of PGE2 (e), the expression of EP2 (f), EP4 (g) and cxcl1 (h) in liver of ethanol-fed mice treated amphotericin B (ampho B) or caspofungin. The level of PGE2 (i), the expression of EP2 (j), EP4 (k) and cxcl1 (l) in liver of the fungi-free mice treated with live M. guilliermondii (Mg). The level of ALT (m), hepatic TG (n), the expression of EP2 (o), EP4 (p) and cxcl1 (q) in liver after oral PGE2. (a and m-n) N = 9–10 per group, (b-d, f-h, j-l and o-q) N = 5 per group, (e and i) N = 7–9 per group. Control: mice received the isocaloric liquid diet instead of ethanol. Alcohol: mice fed with ethanol diet. WIP: mice fed with an ethanol diet supplemented with a water-insoluble polysaccharide from W. cocos. Ampho B: amphotericin B. Data are presented as the mean ± standard error of the mean (SEM). Statistical analysis was done using one-way ANOVA followed by the Tukey post hoc test. Compare to control: # P < .05; ## P < .01; Compare to alcohol, model or Mg: * P < .05; ** P < .01, *** P < .001.
Supplemental material