Figures & data
Figure 1. Increased Enterobacteriaceae and decreased Lactobacillus in large intestine and cecal contents of DSS+Ethanol mice. Cecal and colon contents were harvested from mice after euthanasia on day 7, 3 hours after gavage, followed by DNA isolation, qPCR, and determination of bacterial RQ for (a) Enterobacteriaceae, (b) Lactobacillus, (c) Lactoabacillus:Enterobacteriaceae. Bars display mean ± SEM, with each symbol representing data from one mouse. RQ: Relative Quantity. Statistics by One-Way ANOVA with Tukey post-hoc test. n = 6–8 per group. * p < .05, ** p < .01, **** p < .0001
Figure 2. Lactobacillus:Enterobacteriaceae decreases in DSS+Ethanol fecal pellets from Day 5 to Day 6. Fecal pellets were collected from mice after weighing and prior to gavage followed by DNA isolation, qPCR, and determination of bacterial RQ for (a) Enterobacteriaceae, (b) Lactobacillus, (c) Lactobacillus: Enterobacteriaceae. Some mice did not produce a fecal pellet, limiting continuous sampling from the same mouse, and therefore data are presented as a summary of each experimental group. Symbols represent the mean ± SEM for the experimental group. RQ: Relative Quantity. n = 4–6 per group
Figure 3. Enterobacteriaceae inversely correlates with colon length and Lactobacillus positively correlates with colon length. (a) Cecal Enterobacteriaceae vs colon length linear regression with corresponding R2 value. (b) Cecal Lactobacillus vs colon length linear regression with corresponding R2 value. (c) Pearson correlation matrix examining correlation between colon length, day 7 percent weight change, cecal Enterobacteriaceae, and cecal Lactobacillus. Each symbol represents data from one mouse. RQ: Relative Quantity. Statistics by Pearson correlation. n = 6–8 per group. ** p < .01, *** p < .001, **** p < .0001
Figure 4. DSS decreases intestinal mucin staining and IEC mucin RNA expression with no additional effect after ethanol. (a) PAS-Alcian blue stained slides of distal colon from mice. Representative of 6–8 mice pre-group. Images taken at 400x total magnification. (b) IEC RNA expression of mucins and intestinal trefoil factor. n = 3–5 per group. Bars display mean ± SEM, with each symbol representing data from one mouse. FC: Fold change. Statistics by One-Way ANOVA with Tukey post-hoc test. * p < .05, ** p < .01, *** p < .001, **** p < .0001
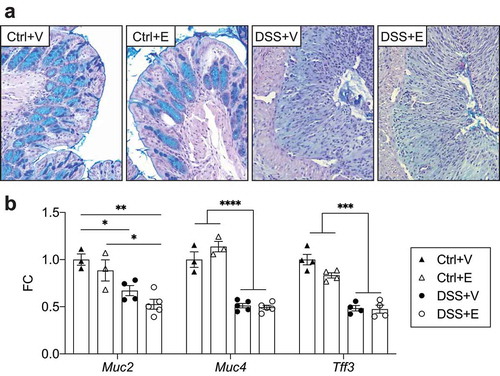
Figure 5. DSS increases bacterial infiltration of intestinal mucosa and decreases expression of tight junction proteins with increases of circulating endotoxin in DSS+Ethanol. (a) Distal large intestine sections displaying localization of bacteria in red. Dashed line represents interface between intestinal epithelium and the intestinal lumen. Representative of 4–6 mice pre-group. Images taken at 400x total magnification. M: Mucosa; L: Lumen. (b) IEC RNA expression tight junction proteins. n = 3–5 per group. (c) Plasma levels of endotoxin. n = 10–16 per group. Bars display mean ± SEM, with each symbol representing data from one mouse. Zo-1: Zonula occludens-1, FC: Fold change. Statistics by One-Way ANOVA with Tukey post-hoc test. * p < .05, ** p < .01, **** p < .0001
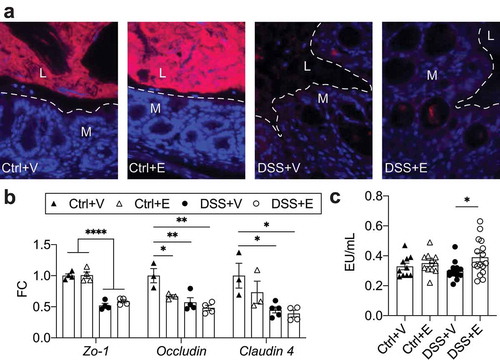
Figure 6. Increased lipid deposition and gene expression associated with lipid synthesis and uptake in DSS+Ethanol livers. (a) Oil Red O stain of frozen liver sections harvested from mice after euthanasia on day 7. Images taken at 400x total magnification. Representative images of n = 6–8 per group. (b) Liver triglyceride mg/g of liver tissue. n = 6–8 per group. (c) Expression of hepatic lipid synthesis and uptake genes. n = 5–8 per group. Bars display mean ± SEM, with each symbol representing data from one mouse. FC: Fold change. Solid lines indicate statistics by One-Way ANOVA with Tukey post-hoc test. Dashed lines indicate significance by student’s t-test. * p < .05, ** p < .01, *** p < .001, **** p < .0001
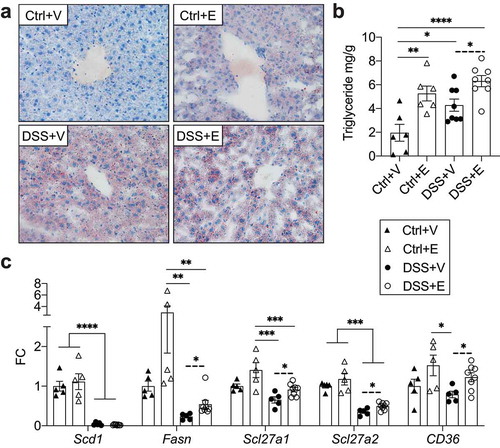
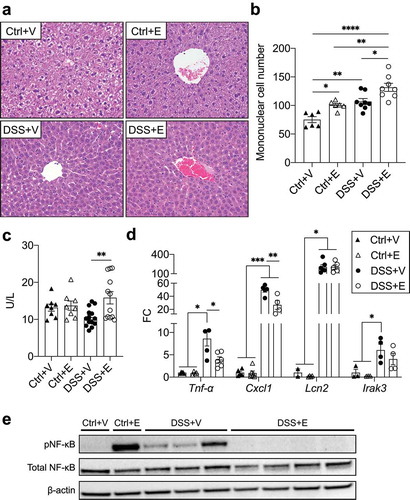
Figure 7. DSS+Ethanol mice exhibit hepatic immune tolerance in the setting of increased plasma ALT. (a) H&E stained liver sections. Taken at 400x total magnification. Images representative of n = 6–8 per group (b) Liver mononuclear cell number counted per liver slide. (c) Plasma levels of ALT. n = 8–14 per group. (d) Liver inflammatory gene expression. n = 3–6 per group. (E) Western blot of liver homogenates for pNF-κB, total NF-κB, and β-actin. Bars display mean ± SEM, with each symbol representing data from one mouse. FC: Fold change. Statistics by One-Way ANOVA with Tukey post-hoc test. * p < .05, ** p < .01, *** p < .001, **** p < .0001